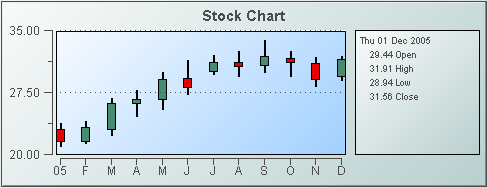
Stock charts
Stock charts visualize live and historical data related to financial instrument trades. They can include overlays that allow the display of data from multiple instruments or the display of periodic events such as stock splits and earnings announcements.
Each plotted point on a stock chart encapsulates four pieces of quantitative information for a particular instrument and time period: opening value, high value, low value, and closing value. Each chart visualizes tabular data that includes a time-valued column as well four numerical columns (for opening, high, low, and closing values).
Use the
priceTraceCurrentTable and
priceTraceHistoryTable properties to attach data to a stock chart. Use the
timeRangeMode property to specify the duration of the time period represented by each plotted point.
Use the
overlayCount property to specify the number of overlays to be included in the chart. Use the
overlayNCurrentTable and
overlayNHistoryTable properties to add the
Nth overlay.
When a stock chart is selected in the Builder canvas, the Object Class Name that appears at the top of the Object Properties pane is obj_stockchart.
The Object Properties panel organizes stock chart properties into the groups below.

