Column | Description |
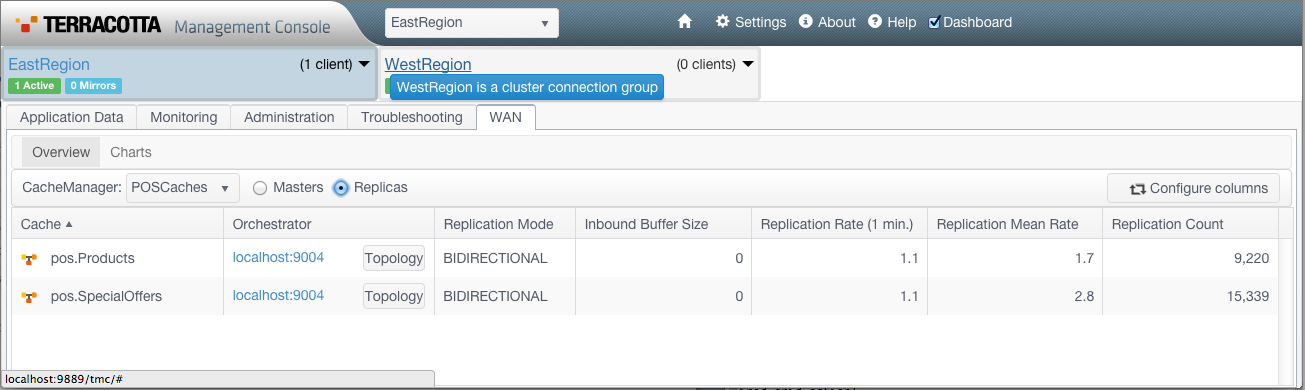
Cache | The replica Orchestrator address (hostname, communication port). |
Orchestrator | The address (the hostname and communication port) of the master cache's Orchestrator process. To display the Orchestrator's XML configuration, click the address link. To view information about your WAN's Orchestrator topology, click Topology. For example: linux-001.net:9001 linux-002.net:9001 |
Replication Mode | The replica cache's replication mode (unidirectional or bidirectional). |
Inbound Buffer Size | The size of the cluster listener buffer. |
Replication Rate (1 Min.) | The average transactions per second (tps) during replication over the last minute. |
Replication Mean Rate | The average transactions per second (tps) over the entire synchronization interval. |
Replication Count | The total number of transactions over the entire synchronization interval. |