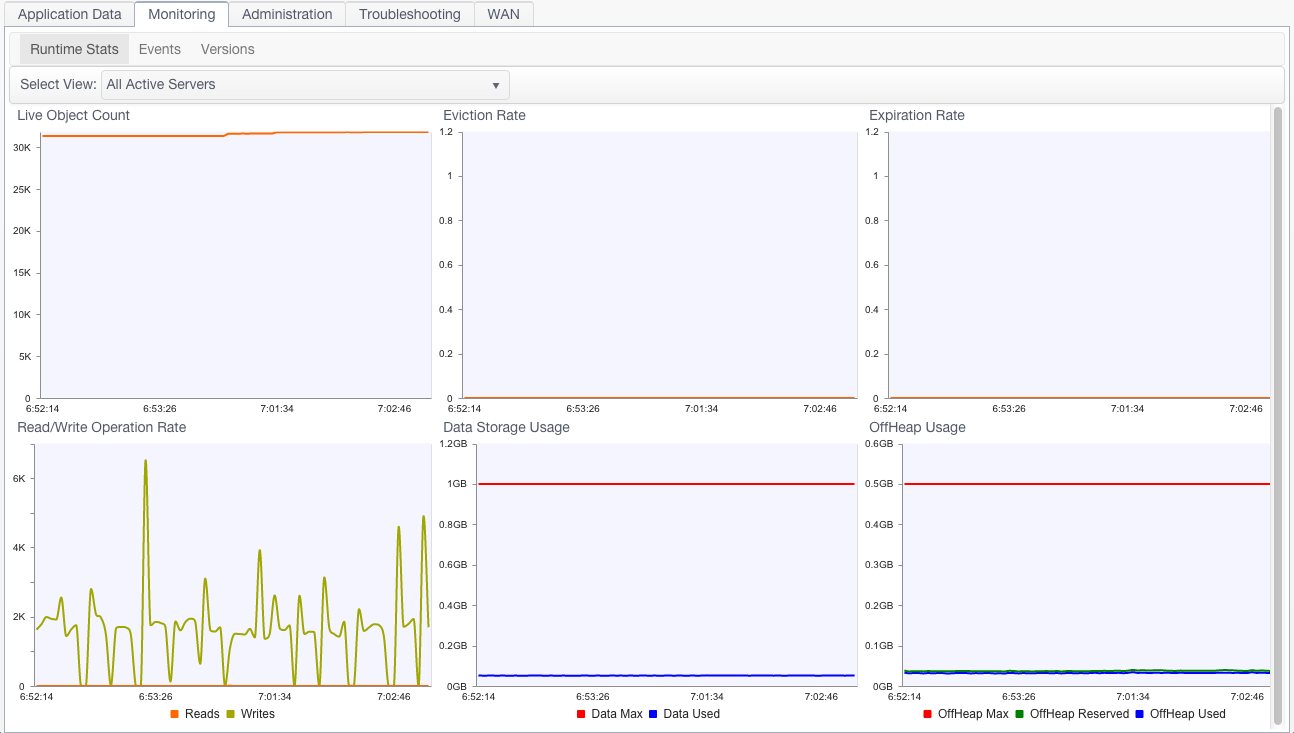
Runtime Statistics
The Runtime statistics graphs provide a continuous feed of server and client metrics. Sampling begins automatically when a runtime statistic panel is first viewed, but historical data is not saved.
Use the Select View menu to set the runtime statistics view to one of the following:
 All Servers
 - Display aggregated statistics for the TSA.
 Specified mirror group
 - Display aggregated statistics for the selected mirror group.
 Specified server
 - Display runtime statistics for the selected server.
 All Clients
 - Display aggregated statistics for all of the cluster's clients.
 Specified client
- Display runtime statistics for the selected client.
Specific runtime statistics are defined in the following sections. The cluster components for which the statistic is available are indicated in the text.
Live Object Count
Shows the total number of live objects in the cluster, mirror group, server, or clients.
If the trend for the total number of live objects goes up continuously, clients in the cluster will eventually run out of memory and applications might fail. Upward trends indicate a problem with application logic, garbage collection, or the tuning of one or more clients.
Eviction Rate
Shows the number of entries being evicted from the cluster, mirror group, or server.
Expiration Rate
Shows the number of expired entries found (and being evicted) on the TSA, mirror group, or server.
Read/Write Operation Rate
Shows the number of completed writes (or mutations) in the TSA or selected server. Operations can include evictions and expirations. Large-scale eviction or expiration operations can cause spikes in the operations rate (see the corresponding evictions and expirations statistical graphs). This rate is low in read-mostly situations, indicating that there are few writes and little data to evict. If this number drops or deviates regularly from an established baseline, it might indicate issues with network connections or overloaded servers.
When clients are selected, this statistic is reported as the Write Transaction Rate, tracking client-to-server write transactions.
A measure of how many objects (per second) are being faulted in from the TSA in response to application requests. Faults from off-heap or disk occur when an object is not available in a server's on-heap cache. Flushes occur when the heap or off-heap cache must clear data due to memory constraints. Objects being requested for the first time, or objects that have been flushed from off-heap memory before a request arrives, must be faulted in from disk. High rates could indicate inadequate memory allocation at the server.
Data Storage Usage
BigMemory Max provides support for a "hybrid" mix of solid-state device (SSD) "flash drives" along with the standard DRAM-based off-heap storage. This Data Storage Usage graph, when compared to the OffHeap Usage graph, shows that the hybrid maximum data storage, which includes both off-heap memory and any "flash drives," can be on an entirely larger scale than off-heap alone.
Data Max shows the total amount of data storage. This is the configured amount (dataStorage size in the tc-config.xml) that can be stored in BigMemory, both in off-heap DRAM and in any SSD flash drive, if BigMemory Hybrid is configured. Data Used shows the amount of the data storage that is currently in use.
OffHeap Usage
Shows the amount, in megabytes or gigabytes, of maximum available off-heap memory (configured limit), the "OffHeap Reserved" (made available), and used off-heap memory (containing data). These statistics appear only if off-heap memory is configured.
OffHeap Max shows the configured maximum amount of off-heap memory (offheap size in the tc-config.xml). OffHeap Reserved shows the amount of off-heap memory that is currently available. OffHeap Used shows the amount of off-heap memory currently in use (containing data).

