Charts Panel
The
Charts panel graphs the same statistics available in the
Overview panel. This is useful for tracking performance trends and discovering potential issues. For more information about the statistics on the
Overview panel, see
Overview Panel.
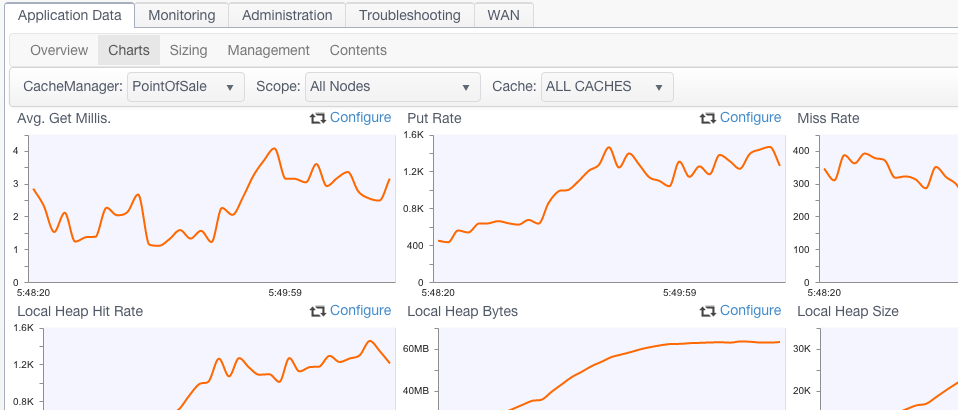
In addition to being able to select a CacheManager and scope for the displayed data, you can also select a specific cache (or all caches) for the selected CacheManager.
Each graph plots the appropriate metrics along the Y axis against system time (X axis). To view the value along a single point on a graph, float the mouse pointer over that point. This also displays the units used for the statistic being graphed.
To choose the type of statistic graphed by a particular chart, click the chart's corresponding Configure link to open a list of available statistics. Choose a statistic, then click OK to accept the change. The chart immediately begins to graph the chosen statistic.