Charts Panel for Replica Caches
Use the Charts panel as an alternative way to view some of the replica cache statistics available on the Overview panel.

To view replica cache information in the Charts panel
1. On the WAN tab, click Charts to display the Charts panel.
2. Select the CacheManager of the replica cache you want to view.
3. Click Replicas.
4. In the Cache field, select the cache you want to view.
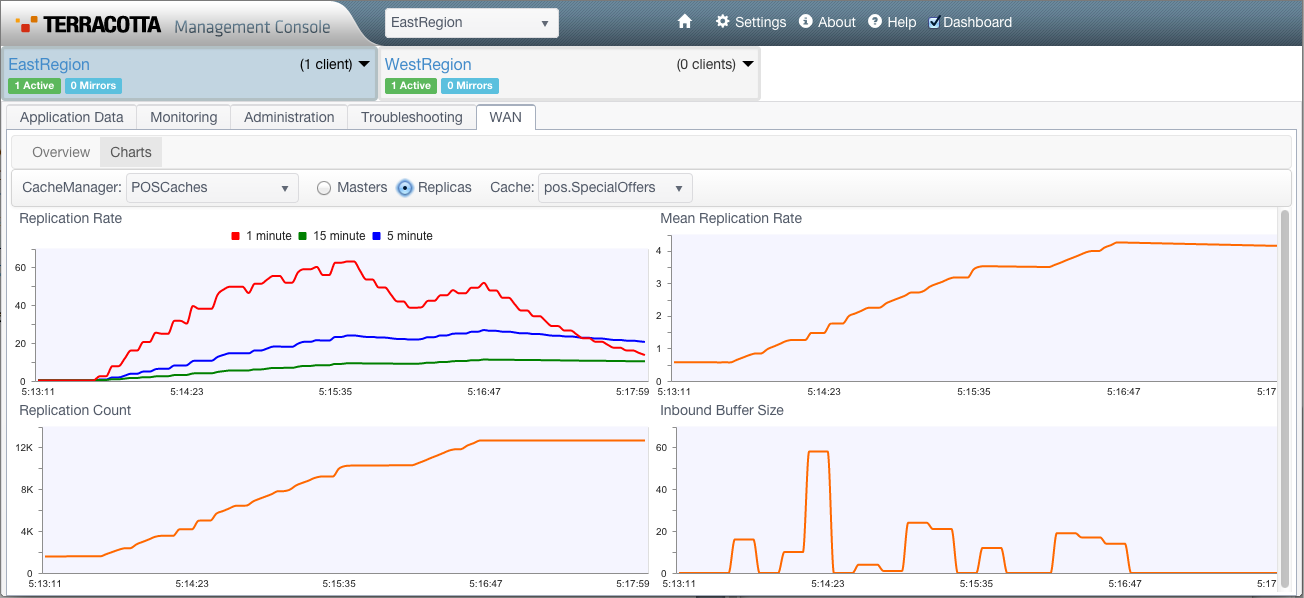
The following charts are displayed:
 Replication Rate:
 Charts the average transactions per second (tps) during replication. This chart plots the replication rates over one-minute, five-minute, and fifteen-minute periods.
Mean Replication Rate: Charts the average transactions per second (tps) rate for your application's entire lifetime.
Replication Count: Charts the total number of transactions during your application's entire lifetime.
Inbound Buffer Size: Charts the size of the cluster listener buffer.