Using the TCStore Tab
The
TCStore tab of the
Detail page opens a view containing detailed statistics for
TCStore dataset operations. The
Detail page is selectable via buttons in the home page (see the section
Using the Configured Connections for details).
There are two TMC panels that show visualizations of the dataset operation statistics:
1. Overview panel: displays the latest statistics for datasets and dataset instances in a tabular layout. Select this view by clicking the icon

.
2. Charts panel: presents a historical view of dataset statistics over a period of time via a graphical layout. Select this view by clicking the icon

.
A dataset (e.g. dataset1) can have multiple instances and you can distinguish each dataset instance by its name, which will end in a dash '-' followed by a number. Thus an instance of dataset1 could be named: dataset1-1.
The following raw counter values, as well as associated rate of change, are available:
Counter | Description |
Add:AlreadyExists | count of adds that failed due to a record with the specified key already existing in the dataset |
Add:Failure | count of unsuccessful additions to a dataset |
Add:Success | count of successful additions to a dataset |
Delete:Failure | count of unsuccessful deletions from a dataset |
Delete:NotFound | count of deletes that failed due to a record with the specified key not existing in the dataset |
Delete:Success | count of successful deletions from a dataset |
Get:Failure | count of unsuccessful gets from a dataset |
Get:NotFound | count of failed gets that were due to no record with the specified key existing in the dataset |
Get:Success | count of successful gets from a dataset |
Update:Failure | count of unsuccessful attempts to update a record in the dataset |
Update:NotFound | count of update failures due to no record with the specified key existing in the dataset |
Update:Success | count of successful record updates |
Stream:Request | count of record streams obtained from the dataset |
Stream:Failure | count of unsuccessful stream requests |
Note: Each of the statistics listed above is a simple counter but each has an associated rate, for instance, Get:Success:Rate, whose units are gets per second.
These dataset operation statistics are sent to the TMS periodically by each dataset client and then are available to view in the TMC.
The TCStore Overview Panel
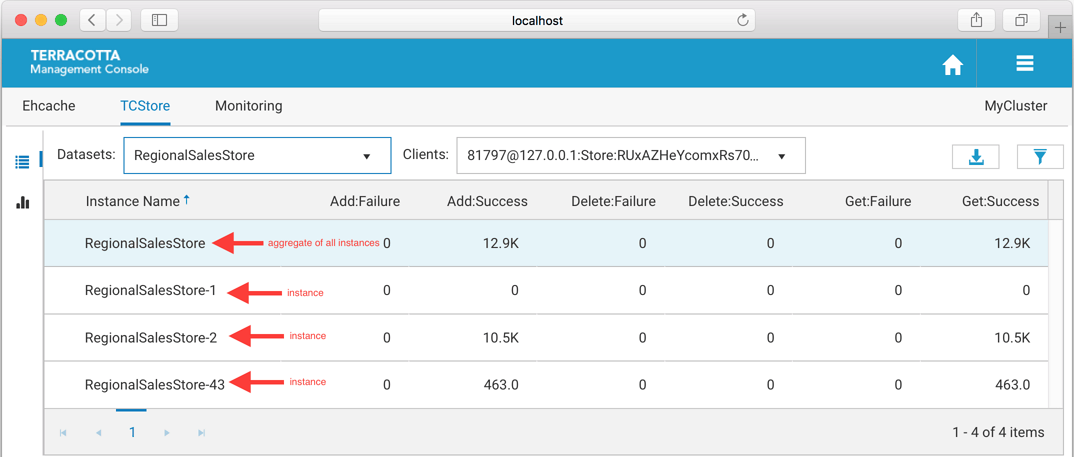
The TCStore overview panel allows you to see the latest real time statistics for all of your datasets. In addition, the datasets can be filtered by:

Dataset name
Clients (Dataset instances in your application)
Note that the top highlighted dataset row is an aggregation of all the dataset instance statistics.
Filter by Dataset Name
The Datasets dropdown option allows you to view a selected dataset. The resulting view will show all dataset instances for the selected dataset.
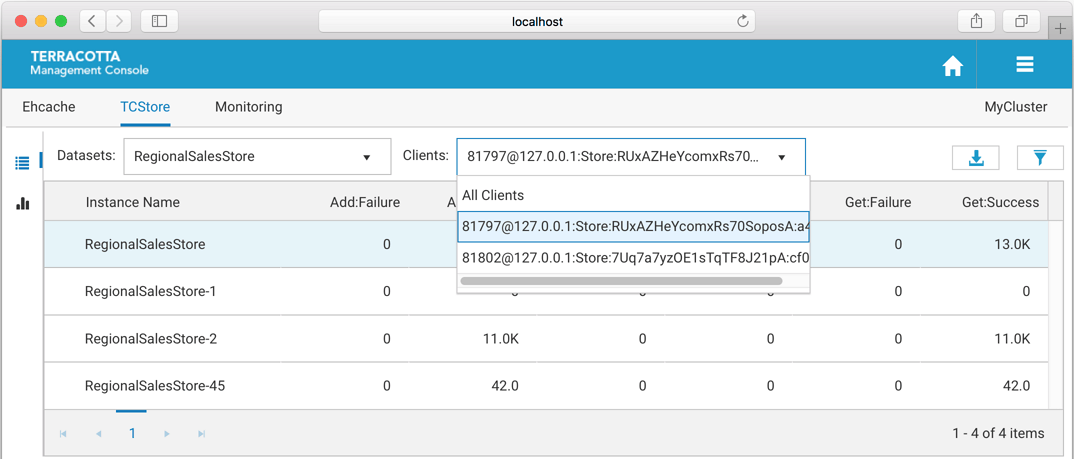
Filter by a single client
The Clients dropdown option allows you to filter by a particular client or all clients. When selecting a single client the result will only include the dataset and dataset instances of the chosen client.
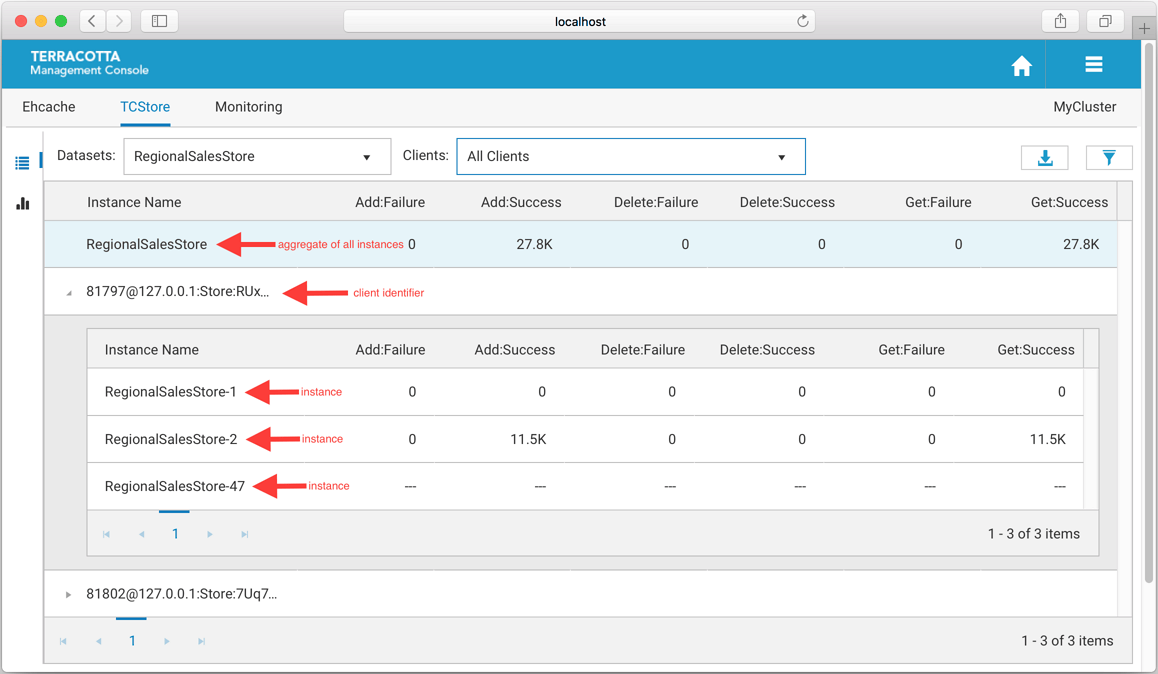
Filter by All Clients
When selecting all clients from the dropdown list the view will slightly change to show all clients for a particular dataset. In this layout the highlighted top row shows the aggregated statistics from all clients for the selected dataset instance. The row directly below the aggregated dataset statistics displays the client identifier, which can be expanded to show statistics for every dataset instance on that client.
Additional Grid Features
Temporarily re-arrange grid columns using drag-and-drop
Sort on columns
Scroll horizontally if the grid columns overflow the available space
Use the Export to Excel (

) icon to download a spreadsheet of the currently displayed values.
Use the Filter dataset statistics (

) icon to select which statistics to display.
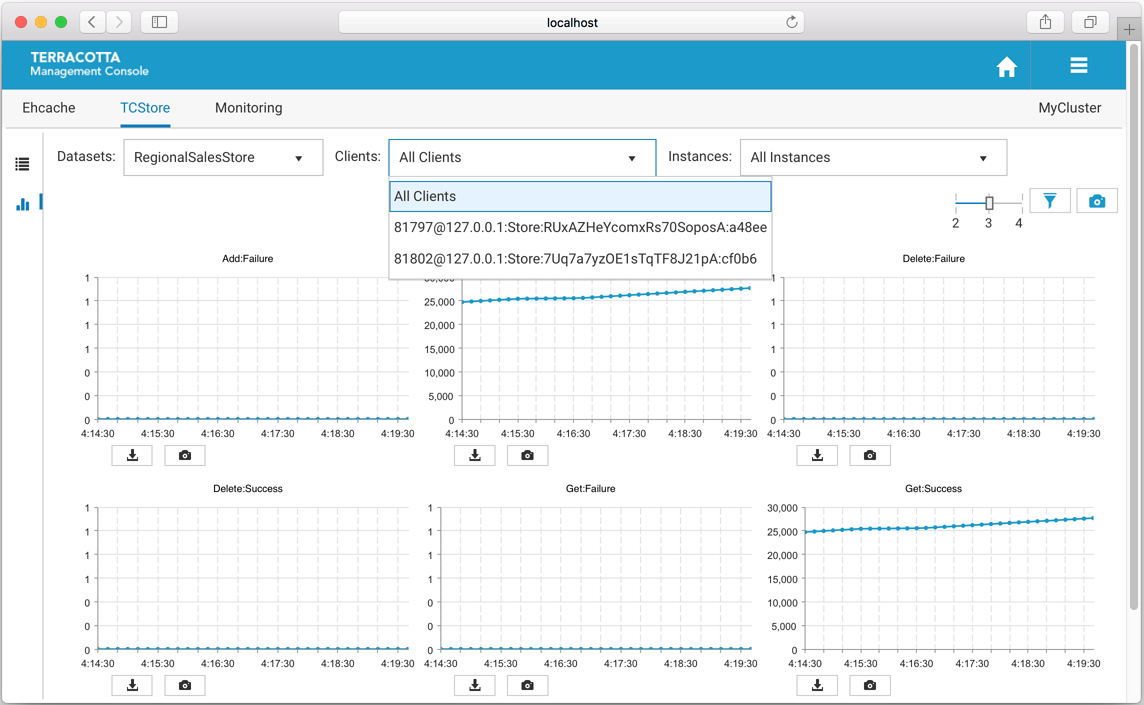
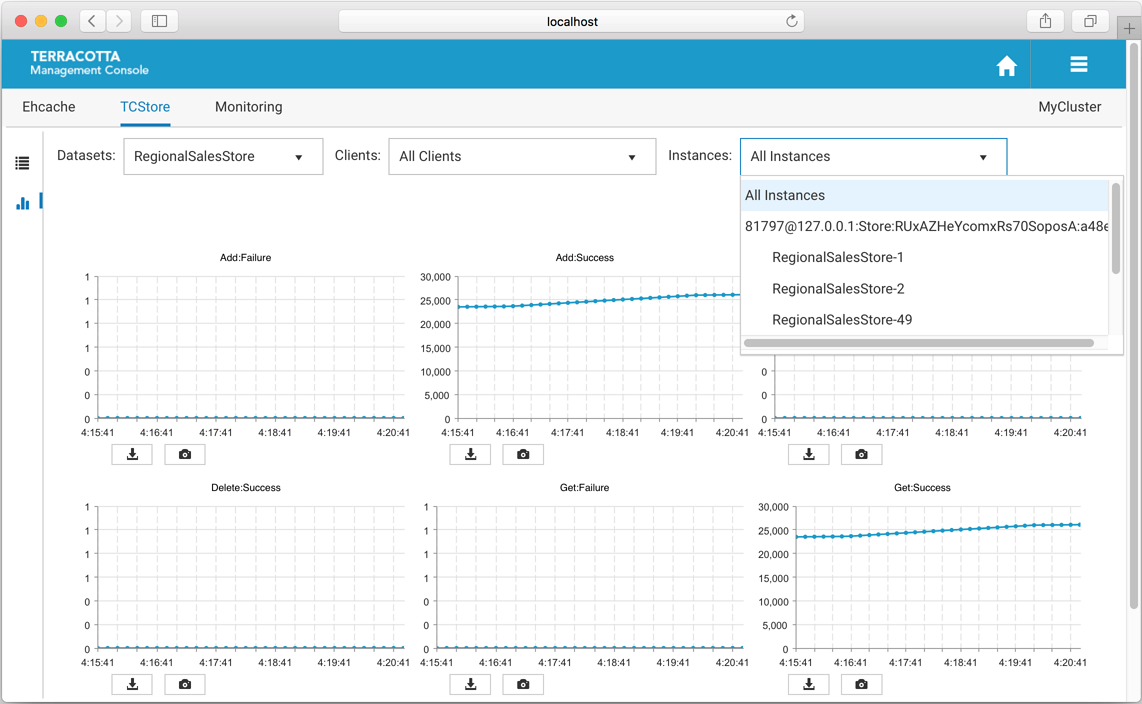
The TCStore Charts Panel
The charts panel allows you to view dataset statistics over a period of time. Each statistic is represented in its own chart which shows its values over the last 5 minutes. This 5 minute window also constantly updates to ensure always seeing the most recent historical statistics.
View by dataset
You can select a dataset to monitor.
Filter by client
There is also an option to filter the history by a specific client or all clients.
one client - you only see dataset statistics for the selected client, which is represented as a client identifier in the dropdown
all clients - the dataset instance statistics are aggregated across all the clients
Filter by instances
You can filter by dataset instances, either by a specific instance or all instances.
one instance - this only shows statistics for the selected dataset instance
all instances - this selection aggregates all dataset instance values for the selected dataset
Use the slider (

) to set how many columns of charts you would like displayed.
Use the
Filter dataset statistics (
) icon to select which statistics to display.
Use the
Take a snapshot of all charts (

) icon to download a single PNG file containing the current values of all displayed charts.
Directly under each individual chart, use the
Export to PDF (
) icon or the
Export to PNG image (
) icon to download the chart in the selected format.
Additional Chart Features
Temporarily re-arrange charts using drag-and-drop
Double-click a chart to get an enlarged snapshot