Using the TCStore Tab
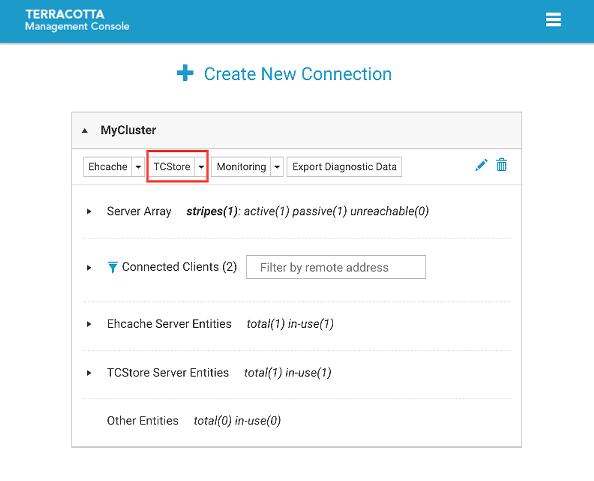
The TCStore tab of the Detail page opens a view containing detailed statistics for TCStore dataset operations. The Detail page is selectable via buttons in the home page.
The following raw counter values, as well as associated rate of change, are available:
Counter | Description |
Add:AlreadyExists | count of adds that failed due to a record with the specified key already existing in the dataset |
Add:Failure | count of unsuccessful additions to a dataset |
Add:Success | count of successful additions to a dataset |
Delete:Failure | count of unsuccessful deletions from a dataset |
Delete:NotFound | count of deletes that failed due to a record with the specified key not existing in the dataset |
Delete:Success | count of successful deletions from a dataset |
Get:Failure | count of unsuccessful gets from a dataset |
Get:NotFound | count of failed gets that were due to no record with the specified key existing in the dataset |
Get:Success | count of successful gets from a dataset |
Update:Failure | count of unsuccessful attempts to update a record in the dataset |
Update:NotFound | count of update failures due to no record with the specified key existing in the dataset |
Update:Success | count of successful record updates |
Stream:Request | count of record streams obtained from the dataset |
Stream:Failure | count of unsuccessful stream requests |
Note: Each of the statistics listed above is a simple counter but each has an associated rate, for instance, Get:Success:Rate, whose units are gets per second.
These dataset operation statistics are sent to the TMS periodically by each dataset client and then are available to view in the TMC.
There are two TMC panels that show visualizations of the dataset operation statistics:

Overview panel: displays the latest statistics for datasets and dataset instances in a tabular layout.
Charts panel: presents a historical view of dataset statistics over a period of time via a graphical layout.
A dataset (e.g. dataset1) can have multiple instances and you can distinguish each dataset instance by its name, which will end in a dash '-' followed by a number. Thus an instance of dataset1 could be named: dataset1-1.
The TCStore Overview Panel
The TCStore overview panel allows you to see the latest real time statistics for all of your datasets. In addition, the datasets can be filtered by:
Dataset name
Clients (Dataset instances in your application)
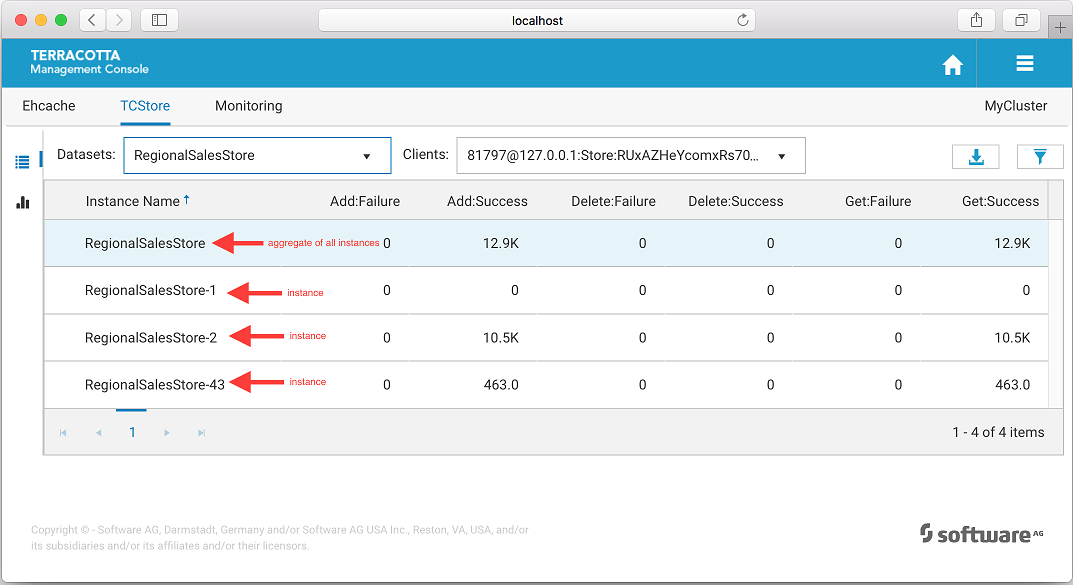
Note that the top highlighted dataset row is an aggregation of all the dataset instance statistics.
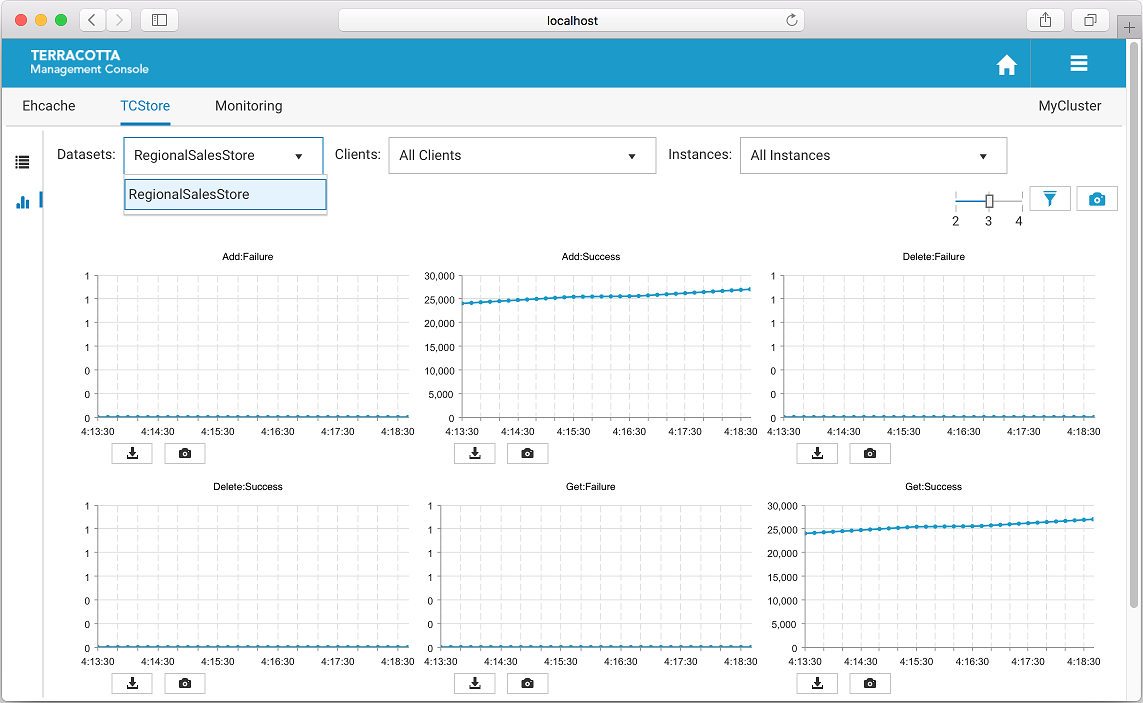
Filter by Dataset Name
The Datasets dropdown option allows you to view a selected dataset. The resulting view will show all dataset instances for the selected dataset.
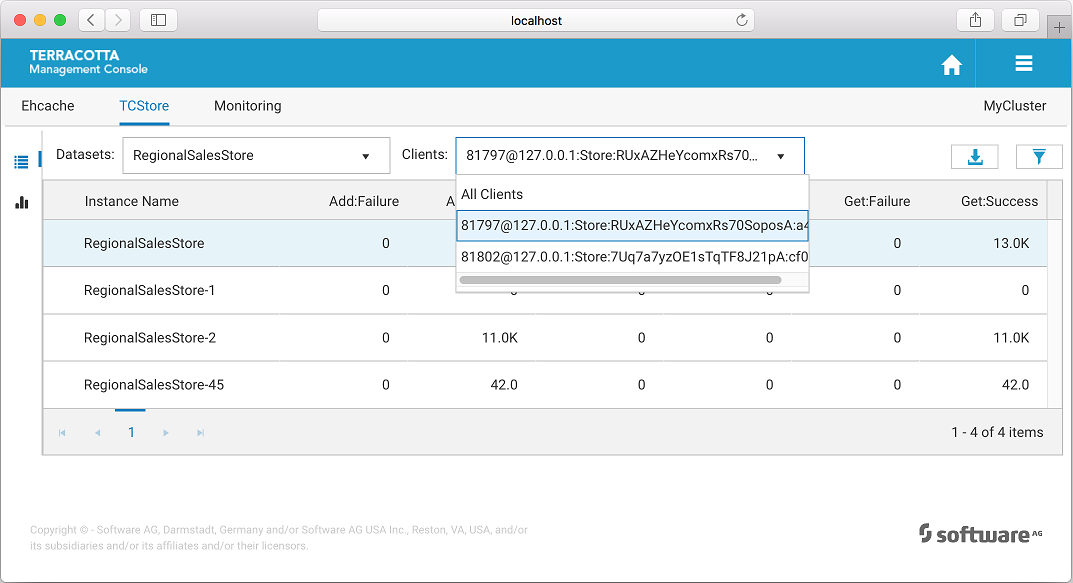
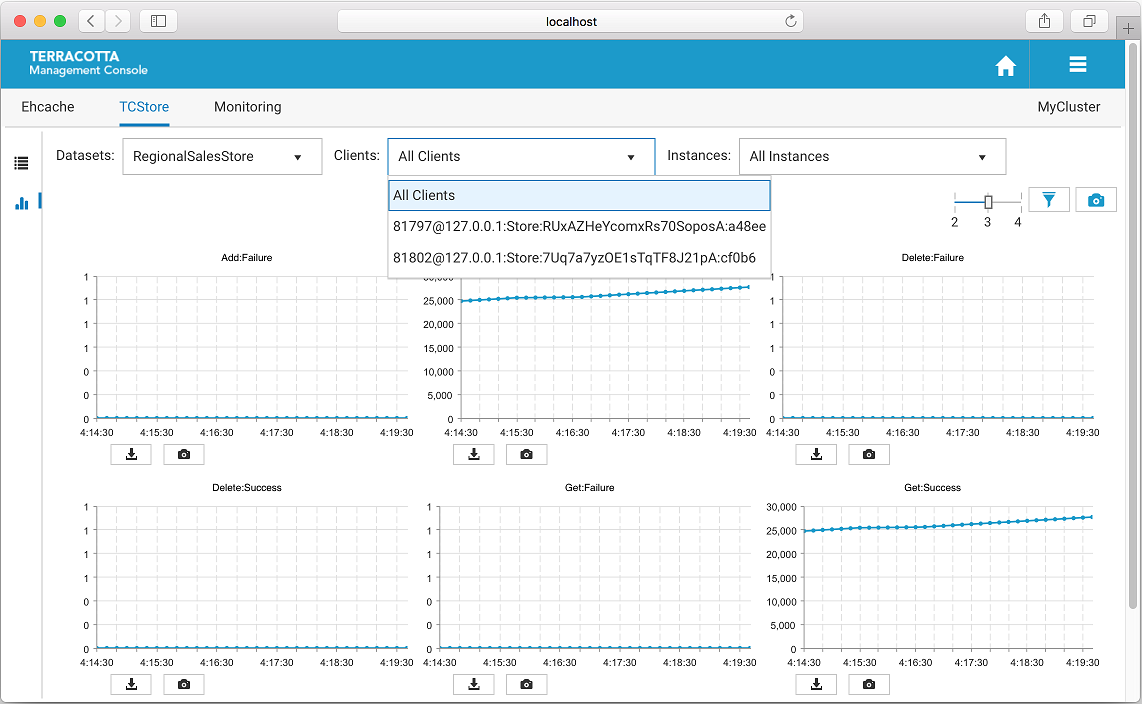
Filter by a single client
The Clients dropdown option allows you to filter by a particular client or all clients. When selecting a single client the result will only include the dataset and dataset instances of the chosen client.
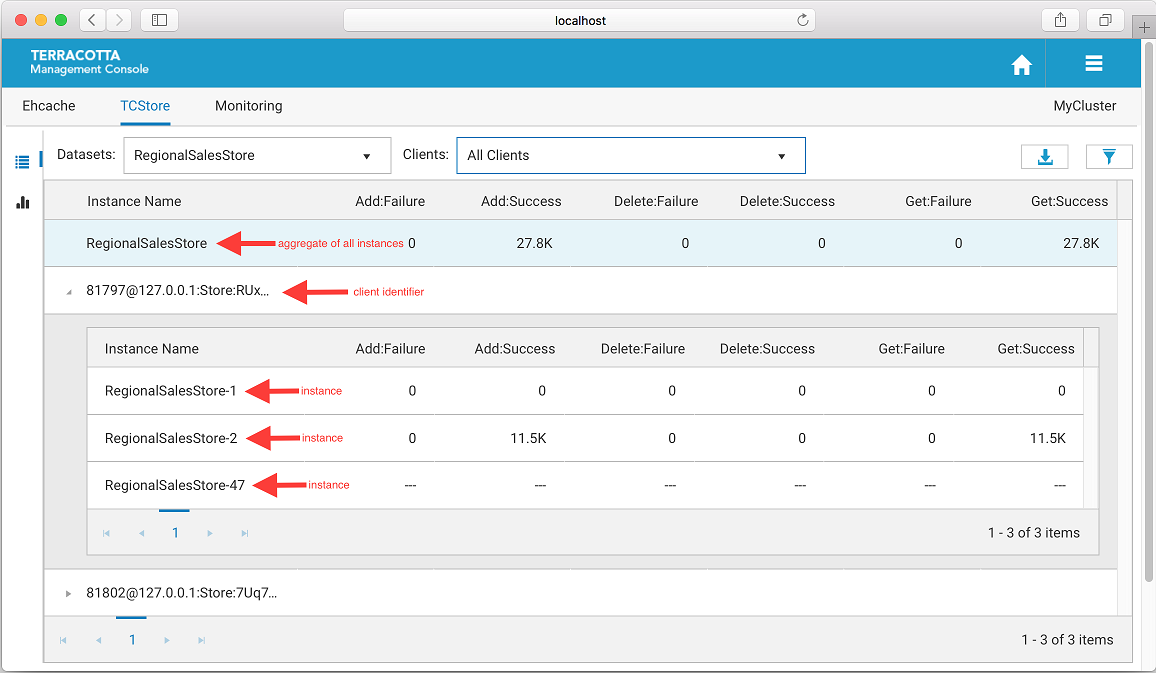
Filter by All Clients
When selecting all clients from the dropdown list the view will slightly change to show all clients for a particular dataset. In this layout the highlighted top row shows the aggregated statistics from all clients for the selected dataset instance. The row directly below the aggregated dataset statistics displays the client identifier, which can be expanded to show statistics for every dataset instance on that client.
Additional Grid Features
Temporarily re-arrange grid columns using drag-and-drop
Sort on columns
Scroll horizontally if the grid columns overflow the available space
Use the Export to Excel (

) icon to download a spreadsheet of the currently displayed values.
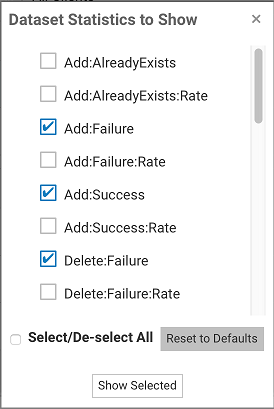
Use the Filter dataset statistics (

) icon to select which statistics to display.
The TCStore Charts Panel
The charts panel allows you to view dataset statistics over a period of time. Each statistic is represented in its own chart which shows its values over the last 5 minutes. This 5 minute window also constantly updates to ensure always seeing the most recent historical statistics.
Filter by dataset
The historical view can be filtered by a particular dataset, which is useful because a dataset could exist on more than one client.
Filter by client
There is also an option to filter the history by a specific client or all clients.
one client - you only see dataset statistics for the selected client, which is represented as a client identifier in the dropdown
all clients - the dataset instance statistics are aggregated across all the clients
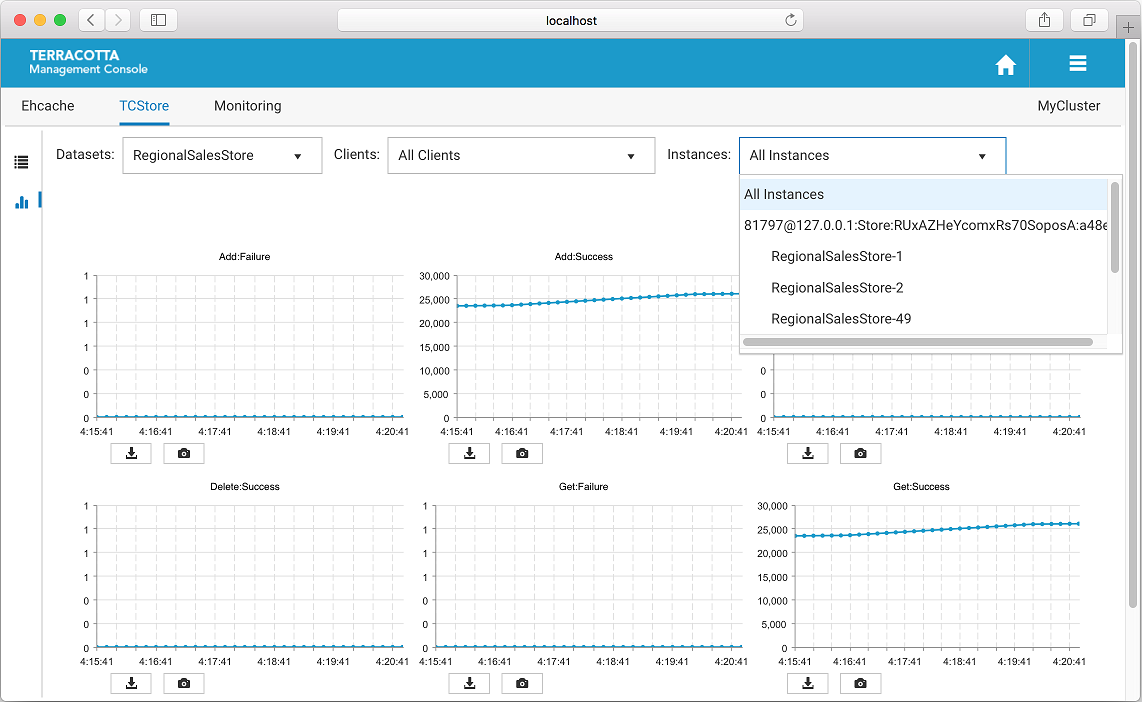
Filter by instances
You can filter by dataset instances, either by a specific instance or all instances.
one instance - this only shows statistics for the selected dataset instance
all instances - this selection aggregates all dataset instance values for the selected dataset
Use the slider (

) to set how many columns of charts you would like displayed.
Use the
Filter dataset statistics (
) icon to select which statistics to display.
Use the
Take a snapshot of all charts (

) icon to download a single PNG file containing the current values of all displayed charts.
Directly under each individual chart, use the
Export to PDF (
) icon or the
Export to PNG image (
) icon to download the chart in the selected format.
Additional Chart Features
Temporarily re-arrange charts using drag-and-drop
Double-click a chart to get an enlarged snapshot
The TCStore Explorer Panel (Ad-hoc Query)
This panel is designed to run ad-hoc queries against a selected dataset in the cluster. It is not meant to replace programming Stream queries or the SQL query API. The panel’s typical use case is: When you need to verify the existence of a record in an ad-hoc manner, you can run simple queries in this panel and check the result.
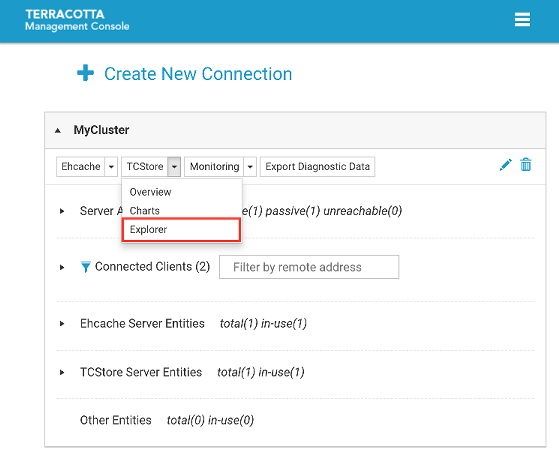
Access to the panel
From the Landing Page,
Select "Explorer" under "TCStore" button group,
You will see the Explorer Panel (under the TCStore tab)
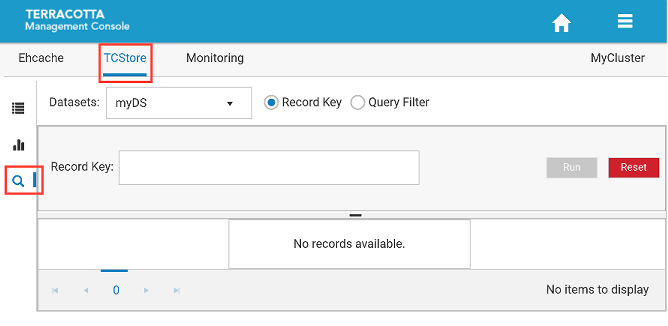
A dataset must be a selected, as every query is executed against a particular dataset. If your cluster already contains datasets, the dropdown list will be populated. From this dropdown the dataset to be queried can be selected. If there is no dataset existing in your cluster, there will be a notification window indicating the error.
There are 2 query methods to choose from:
1. Query by Record Key
2. Query by Filters
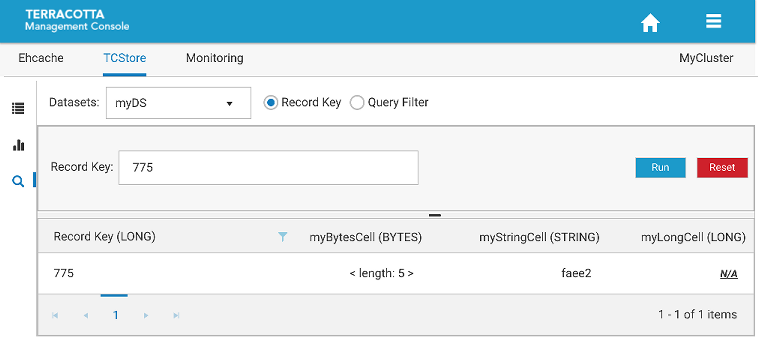
Query by Record Key
If you know the record key you want, you can query by record key. Record key can be all valid Cell types except BYTES. Normally, the result should contain only one record.
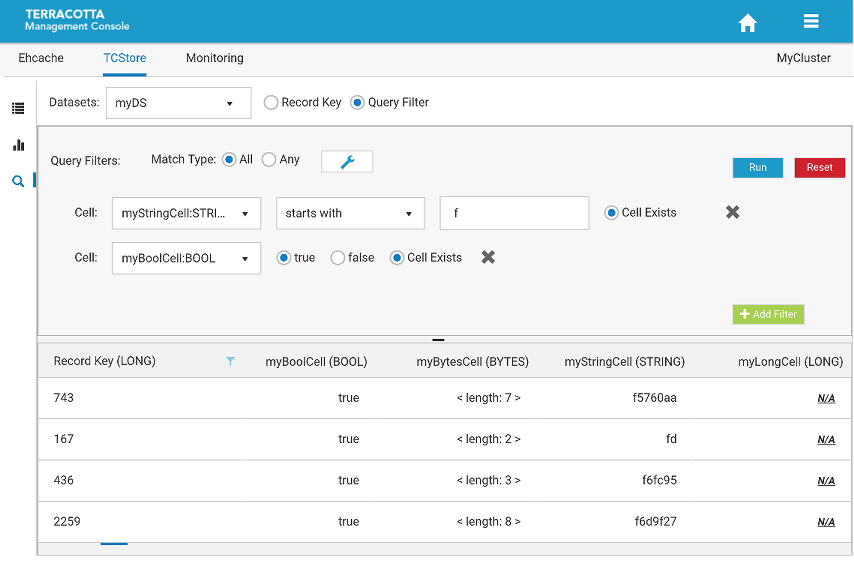
Query by Filters
If you don’t know the record key, but you have some ideas about how certain Cells should look like, you can search by filters. The limitation is: You cannot filter by BYTES Cells.
You can add or remove filters. Each filter is targeted at a certain cell type (defined by cellName:cellType). Depending on the cell type, you have different query options. For example, if you select a STRING cell, then the operators can be "equals" and "starts with", which corresponds to the portable TCStore API. Additionally, you can uncheck the "cell exists" option, and filter for all the records that MUST NOT contain the cell. This is different to not specifying any filter for the cell: If you do not specify any filter for "myStringCell", the returned records MAY OR MAY NOT contain "myStringCell". If any filter input field contains characters that cannot be converted to the target cell type, then an error notification will be displayed.
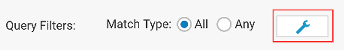
To simplify things, all the filters share the same connecting logic: You can choose "match All" or "match Any". Default is "match All".
When you think your filters look good, you can click "Run" button, and the query will be executed in the cluster against the selected dataset, in an optimized way. If you want to start over, click "Reset" button, it will clear all filters.
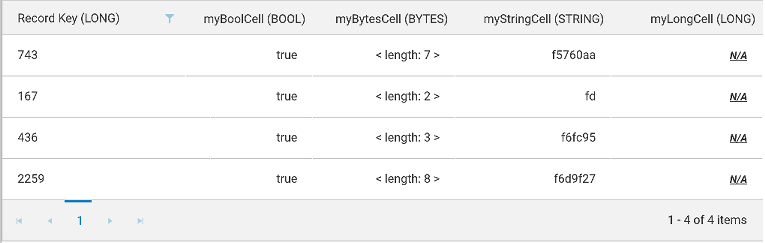
Grid Details
The first column will always be Record Keys, with the key type shown in the header. Each cell header will also include the cell type. If the cell type is BYTES, the content is not rendered in String, as this would be meaningless for human consumption. Instead, the length of the Bytes content is displayed. If a record does not contain a certain cell, then you will see a specially formatted [underline]N/A. This is to visually differentiate from a String cell with content "N/A".
You can choose to sort records by column, by clicking any of the column headers. You can further filter records by records keys, by clicking on the "funnel" icon in Records Key column header.
The maximum number of records that can be returned is set to 100, a pre-determined value, intended to avoid the complete dataset to be returned to the client (and front-end UI). It is recommended to specify sufficient filters to narrow the return to only a couple of records.
Sample Cells and its configuration (advanced topic)
If you click on Sample Cells configuration button,
you will see the Sample Cell Configuration popup window,
Sample Cells is an advanced feature. Use it only if you are sure that the returned records do not match your expected schema. Since TCStore datasets do not enforce any schema, you can have records with very different Cells (cell name and/or cell type). The management console has to send a query to sample some records/cells in order to get a general sense of the schema in order to parse and show results in the grid. The sampled cells may not represent the accurate schema. For example, you may have a cell called "myLongCell" but it’s not sampled, so it will not show up in the grid. In such a situation, you have 2 options:
1. Re-sample cells until the schema matches
2. Add a custom cell with cell name "myLongCell" and cell type "LONG"
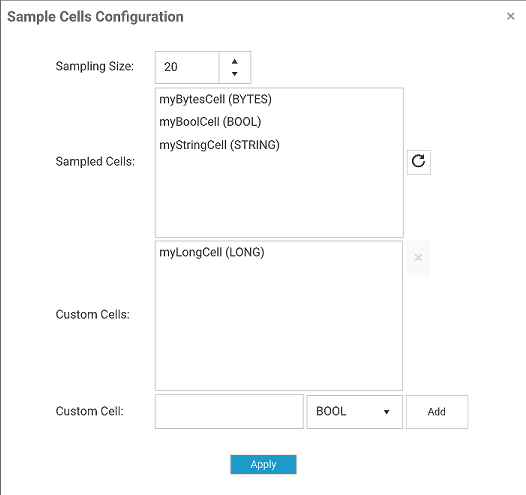
This UI window provides all features mentioned above. It features three major parts:
You can specify a sample size. The larger the number, the more accurate, but the slower its performance. Default value is 20
You can re-sample the cells and the results will be listed in "Sampled Cells" list
You can add custom cells by specifying a cell name and cell type, and the current list of custom cells will be listed in "Custom Cells" list
Duplicated cells do not cause any problems, but we recommend to remove the duplicate cells in "Custom Cell" list and keep only what is needed.
The TCStore Query Statistics Panel
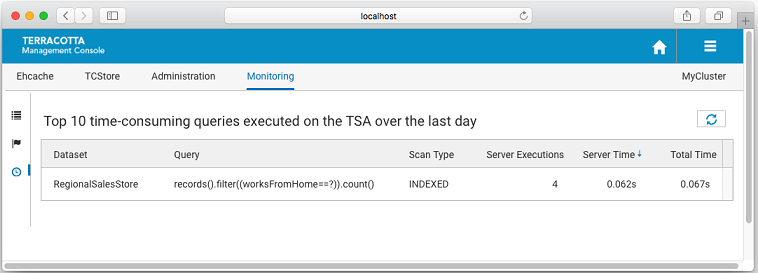
The Query Statistics tab of the Monitoring panel displays the top TCStore server-side query pipelines ordered by the total amount of server time they are costing.
Each query pipeline entry is comprised of the following fields:
Field | Description |
Dataset | Name of the Dataset upon which the query was executed |
Query | Shape of the server-side query pipeline |
Scan Type | If the query pipeline took advantage of indexes (INDEXED) or needed to do a full scan (FULL) |
Server Executions | Number of times the pipeline was presented to a server for execution |
Server Time | Time taken (wall clock) by the servers to handle the query pipeline |
Total Time | Time (wall clock) the query stream was held open |
This information is not held by the TMS persistently, rather, it is obtained by querying each server.
These query statistics are refreshed automatically each time the tab is visited. The Refresh button at the top-left of the presentation is used to update the grid.