Using the Monitoring Tab
The Monitoring tab of the Detail page is where you can find information relating to the server-side of your application. The Detail page is selectable via buttons in the home page.
You can view:

Resource usage relating to your cache's or dataset's use of the Terracotta Server's configured resources. Select this view by clicking the icon

.
Event log details. Select this view by clicking the icon

.
Resource Usage Panel
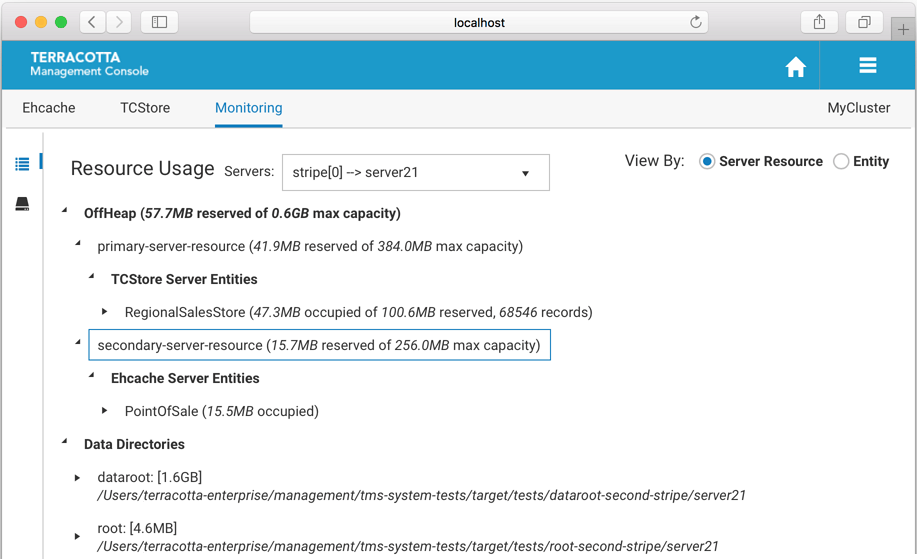
The Resource Usage Panel displays information relating to your cache's or dataset's use of the Terracotta Server's configured resources, including OffHeap memory and Fast Restartable Store (FRS) data directories.
Use the Servers dropdown to view the resource usage of a particular Terracotta Server.
Use the View By radio buttons to toggle between a server resource or a caching entity-focused presentation, as shown below.
OffHeap
The Server Resource view shows how caching entities are making use of the allocated OffHeap resources configured for the server. Any number of server entities can use a particular server resource simultaneously.
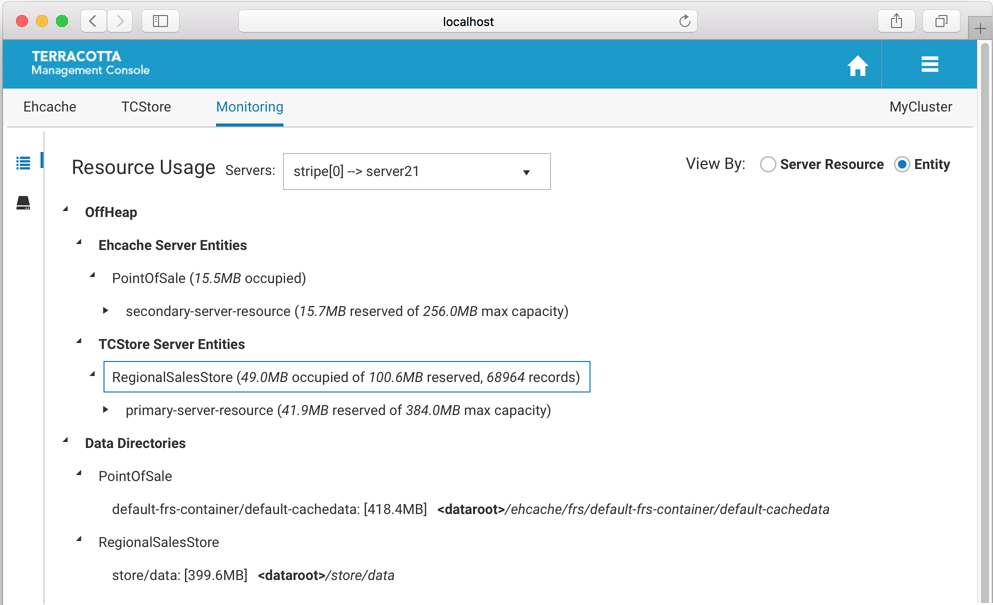
The Entity view shows how caching entities are using the OffHeap resources configured for the server.
A caching entity can be configured to make use of one or more server resources via the pools (both shared and dedicated) they carve out of those server resources. Caches can be configured to store their entries in the pools configured by their containing CacheManager. The amount of space occupied by a caching entity is displayed, along with the total amount of space reserved for the pool.
While caching entities are associated with offheap resource pools, dataset entities make use of server offheap resources directly. The amount of space occupied by the dataset entity, the total amount of space reserved for the offheap server resource, as well as the count of records stored are displayed. Further, the cell names of the indexes that have been defined on your dataset, the type of index, the amount of offheap space occupied, the count of records indexed, and the number of times the index has been used are all displayed.
Data Directories
Data directories are configured in the server configuration and your application points to these named disk areas for persistent storage.
For each defined data directory, the filesystem location and occupied space are displayed, as well as the names of the server entities utilizing the directory and amount of filesystem space each is occupying.
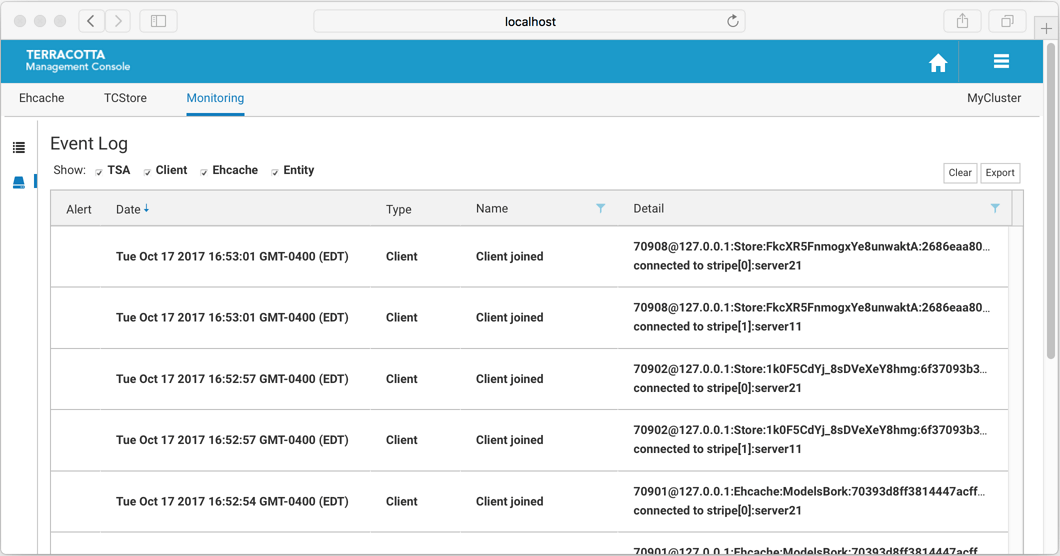
Event Log
The Event Log tab of the Monitoring panel displays, in reverse chronological order, important activities occurring in your cluster. The TMS listens for and persists these events, meaning that if the TMS is not running no events will be stored.
The types of activities that generate events include:
server state transitions
clients connecting/disconnecting to TSA stripes
server entities being created/destroyed
resource constraint alerts
and more
The event log is included in the set of diagnostics artifacts that can be downloaded from the cluster's connection panel on the Home Page, but in addition it can be downloaded separately using the Export button.
Events that are deemed to be critical are noted as alerts, displayed with an attention-focusing icon in the alert grid. Further, alert events are displayed in a temporary popup and the count of un-read alerts is shown in the cluster's connection panel on the Home Page.
Newly added events are shown in the grid with bold text, and reset to normal after navigating away.
An event is comprised of the following fields:
alert | Is this event deemed critical? |
Timestamp | Time at which the TMS recorded the event |
Type | Categorization of the event |
Name | Sub-categorization |
Detail | Description of the event |
The maximum number of events that are saved in the TMS is controlled by the configuration property tms.eventLogMaxRecords, whose default value is 5000. The event log store in the TMS, as well as the event log grid, can be cleared using the Clear button.