Using the Ehcache Tab
The
Ehcache tab of the
Detail page contains detailed presentations relating to your caching clients. The
Detail page is selectable via buttons in the home page (see the section
Using the Configured Connections for details).
You can view:

Overview statistics concerning this moment in time, in grid form. Select this view by clicking the icon

.
Historical statistics, in chart form. Select this view by clicking the icon

.
Cache size information. Select this view by clicking the icon

.
Your caching client automatically gathers and periodically sends to the TMS low-level statistics concerning counters and sizing. From those low-level statistics the TMS can synthesize a variety of derived statistics, such as rates (HitRate) and ratios (HitRatio).
The following categories of statistics are available:
Category | Description |
Cache | encompasses all the following caching tiers |
OnHeap | the JVM heap tier |
OffHeap | the JVM OffHeap (direct memory) tier |
Disk | the disk tier |
Clustered | the cluster tier |
The following raw counter values, as well as associated rate of change, are available for each category listed above:
Counter | Description |
<Category>:PutCount | number of times your application has put a new entry into the cache |
<Category>:UpdateCount | number of times your application has put a new entry into the cache that replaced an existing entry (same key) |
<Category>:RemovalCount | number of times your application explicitly removed an entry from the cache |
<Category>:ExpirationCount | number of entries removed from the cache due to an expiration policy (time-to-live, etc.) |
<Category>:EvictionCount | number of entries removed from the cache due to space constraints |
<Category>:HitCount | number of gets that returned an existing entry |
<Category>:HitRatio | ratio of hits to gets |
<Category>:MissCount | number of gets that did not return an entry |
<Category>:MissRatio | ratio of misses to gets |
The following category-specific raw counters are also available:
Counter | Description |
Disk:MappingCount | number of entries stored on disk |
Disk:OccupiedByteSize | total size of all entries stored on disk |
OffHeap:MappingCount | number of entries stored in direct memory |
OffHeap:OccupiedByteSize | total size of all entries stored in direct memory |
OnHeap:MappingCount | number of entries that store in regular heap memory |
OnHeap:OccupiedByteSize | total size of all entries store in regular heap memory |
Note: Ratios and Rates
The TMS gathers raw counters from your application and the servers. Rates of change (rates) and ratios are synthesized based on windowed sample averaging. For example, the TMC requests 30 samples over the last 5 minutes for display in the Charts panels. The median raw counter values are calculated for each window, from which rates and ratios can be derived.
The units for rates are always operations per second. Ratios are unitless.
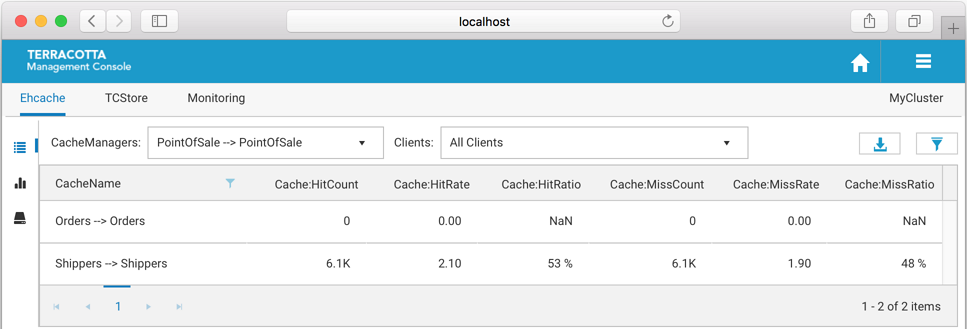
Overview Panel
The Overview Panel lets you view statistics concerning what is happening right now (or just a while ago) with your caching client, broken out by cache. By default the statistics are aggregated across all clients using the same CacheManager. Any particular caching client can also be selected for viewing.
Use the CacheManagers dropdown to select the aliased CacheManager for which to show statistics. The entries in this dropdown are of the form CacheManager Alias > Storage Handle due to the fact that different client-side CacheManagers can be configured to use the same storage on the TSA. Furthermore, CacheManagers that are otherwise identical can be configured with different aliases. We show the mapping here so you have a chance to disambiguate CacheManagers should you choose to configure them in this way.
Use the Clients dropdown to select a particular caching client for viewing. By default, statistics are aggregated across all clients of the selected CacheManager.
Additional Grid Features
Temporarily re-arrange grid columns via drag-and-drop
Sort on columns or filter on CacheName
Scroll horizontally if the grid columns overflow the available space
Use the
Export (

) icon to download a spreadsheet of the currently displayed values.
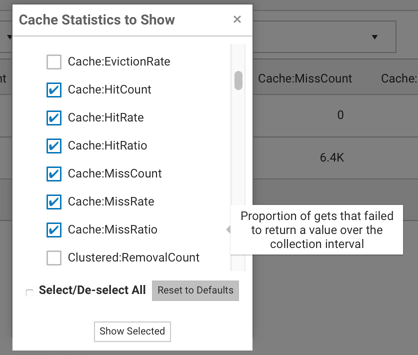
Use the
Filter cache statistics (

) icon to select which statistics to display. The set of statistics to view defaults to
Cache-level statistics that are applicable to all use-cases.
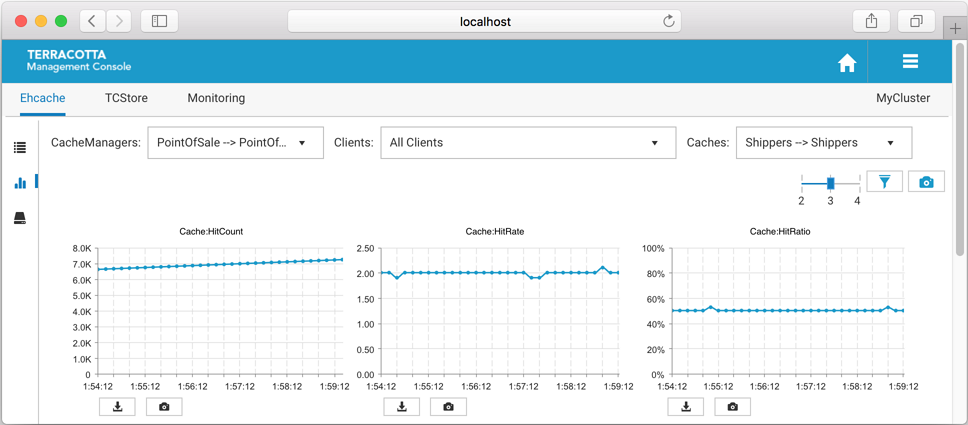
Charts Panel
The Charts Panel lets you view statistics over the past 5 minutes. The TMC requests 30 samples be returned. Unlike the Overview Panel, which shows all the caches contained by the selected CacheManager, the Charts Panel shows statistics for particular caches.
Use the CacheManagers dropdown to select the aliased CacheManager for which to show statistics. The entries in this dropdown are of the form CacheManager Alias > Storage Handle due to the fact that different client-side CacheManagers can be configured to use the same storage on the TSA. Furthermore, CacheManagers that are otherwise identical can be configured with different aliases. We show the mapping here so you have a chance to disambiguate CacheManagers should you choose to configure them in this way.
Use the Clients dropdown to select a particular caching client for viewing. By default, statistics are aggregated across all clients of the selected CacheManager.
Use the Caches dropdown to select a particular cache for viewing. By default, the first cache listed is selected.
Use the slider (

) to set how many columns of charts you would like displayed.
Use the
Filter cache statistics (
) icon to select which statistics to display. The set of statistics to view defaults to
Cache-level statistics that are applicable to all use-cases.
Use the
Take a snapshot of all charts (

) icon to download a single PNG file containing the current values of all displayed charts.
Directly under each individual chart, use the
Export (
) icon or the
Export to PNG image (
) icon to download the chart in the selected format.
Additional Chart Features
Temporarily re-arrange charts via drag-and-drop
Double-click a chart to get an enlarged snapshot
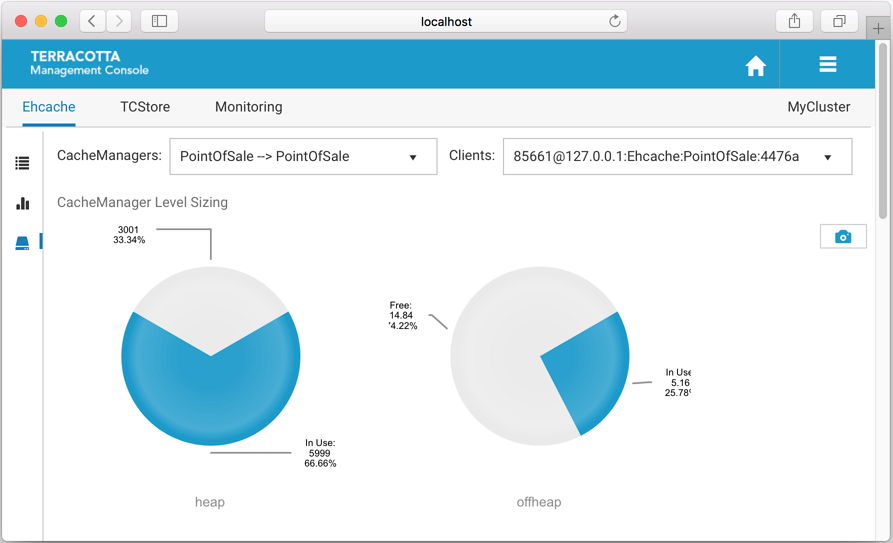
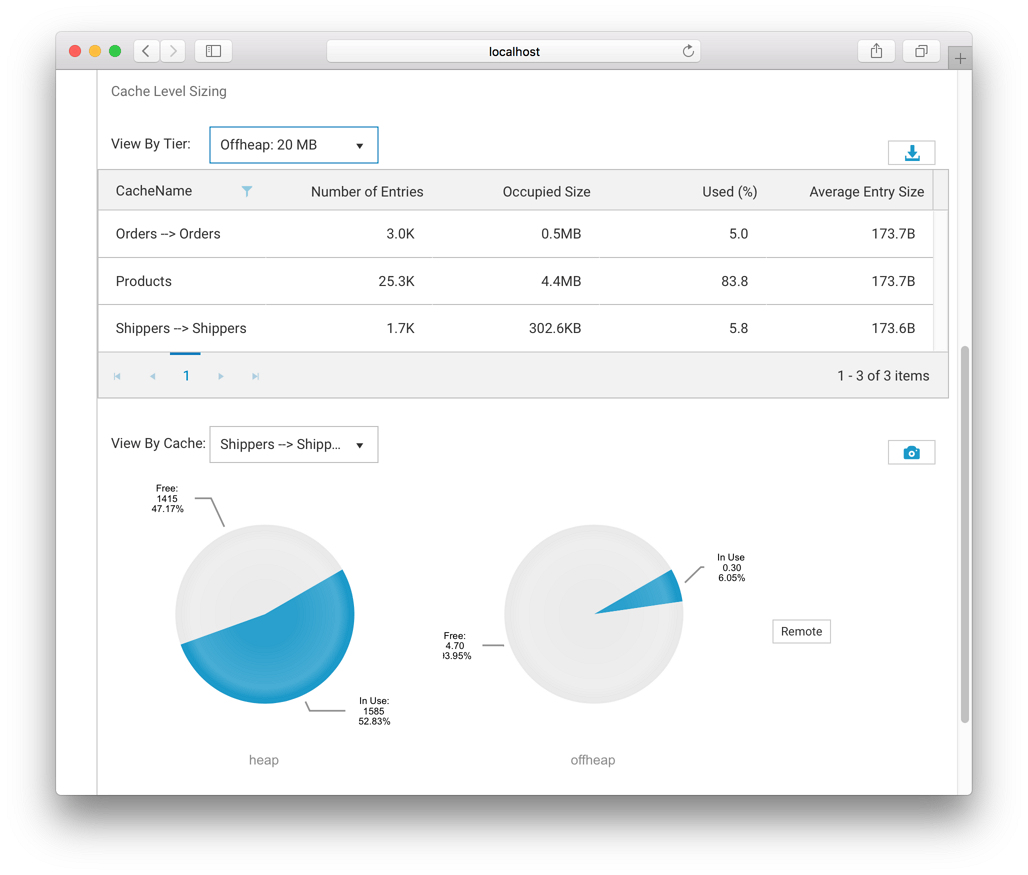
Sizing Panel
The Sizing Panel shows how much space is being used by your CacheManagers and caches across the different local storage tiers you've configured. Sizing information related to the Clustered Storage Tier can be accessed via the Remote buttons.
The Sizing Panel is composed of two sections: CacheManager Level Sizing and Cache Level Sizing.
CacheManager Level Sizing Shown is a pie chart for each local storage tier you've configured for use by your caches, displaying the amount of the available storage that is being used.
Use the CacheManagers dropdown to select the aliased CacheManager for which to display sizing information.
Use the Clients dropdown to select a particular caching client for which to display sizing information. By default the first client listed is selected.
Use the
Remote button to navigate to the Resource Usage panel to view how the server-side caching entity is making use of the server’s configured resources, such as OffHeap storage. See the section
Resource Usage Panel for related information.
Cache Level Sizing Use the View By Tier dropdown to view tier-specific sizing information for all caches contained by the selected CacheManager in grid form.
Byte-sizing Limitations
Cache tiers that are sized by entries cannot provide Occupied Size or Average Entry Size and are displayed as N/A for Not Applicable.
Use the View By Cache dropdown to view the tier usage breakdown for a particular cache, in pie chart form.