Viewing a Realm
The Realm view provides an overview of the characteristics the current status of the set of Universal Messaging realms that Enterprise Manager is monitoring. When you select a realm node from the namespace, the status panel is displayed by default for the realm.
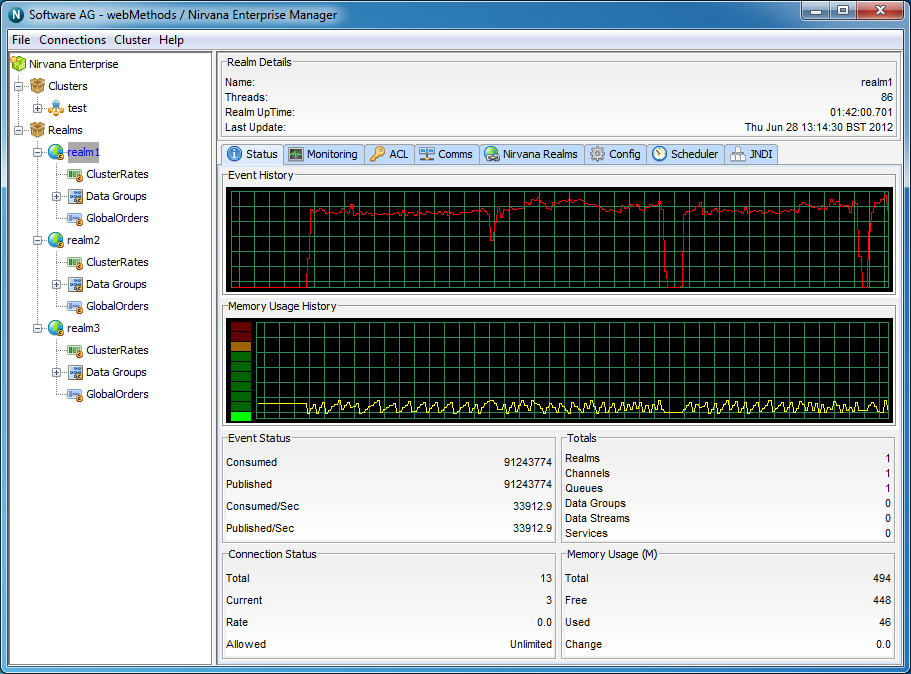
The top of the screen displays a panel containing several values. These values are :
 Name
Name - The name of the selected realm
Threads - Number of threads within the Realm Server's JVM
Realm Up Time - How long the realm has been running for
Last Update - The time that the last status update was sent by the realm
The Status panel contains real time graphs illustrating the total number of events published (yellow) and consumed (red) across the Universal Messaging Realm, as well as the memory usage history for the selected realm.
The bottom of the screen displays 4 panels named Event Status, Totals, Connection Status and Memory Usage. These panels and the information displayed are described below.
Event Status
The Event Status section describes the following values :
Consumed - The total number of events consumed from all channels, queues and services within the realm
Published - The total number of events published to all channels, queues and services within the realm
Consumed/Sec - The number of events consumed from all channels, queues and services, per second within the realm
Published/Sec - The number of events published to all channels, queues and services, per second within the realm
Totals
The Totals section describes the following values :
Realms- The number of realms mounted within this realm's namespace
Channels- The number of channels that exist within this realm
Queues- The number of queues that exist within this realm
Data Groups- The number of data groups that exist within this realm
Data Streams- Total number of data streams that exist within this realm
Connection Status
The Connection Status section contains the following values :
Total - The total number of connections made to this realm
Current - The current number of connections to this realm
Rate - The number of connections being made per second to this realm
Allowed - The permitted number of concurrent connections
Memory Usage(MB)
The Memory Usage section contains the following values :
Total - The total amount of MB allocated to the Realm JVM, specified by the -Xmx value for the JVM
Free - The amount of JVM memory available for the Realm
Used - The amount of JVM memory used by the Realm
Used/sec - The amount of memory used per second by the Realm between newest update and previous update