Top
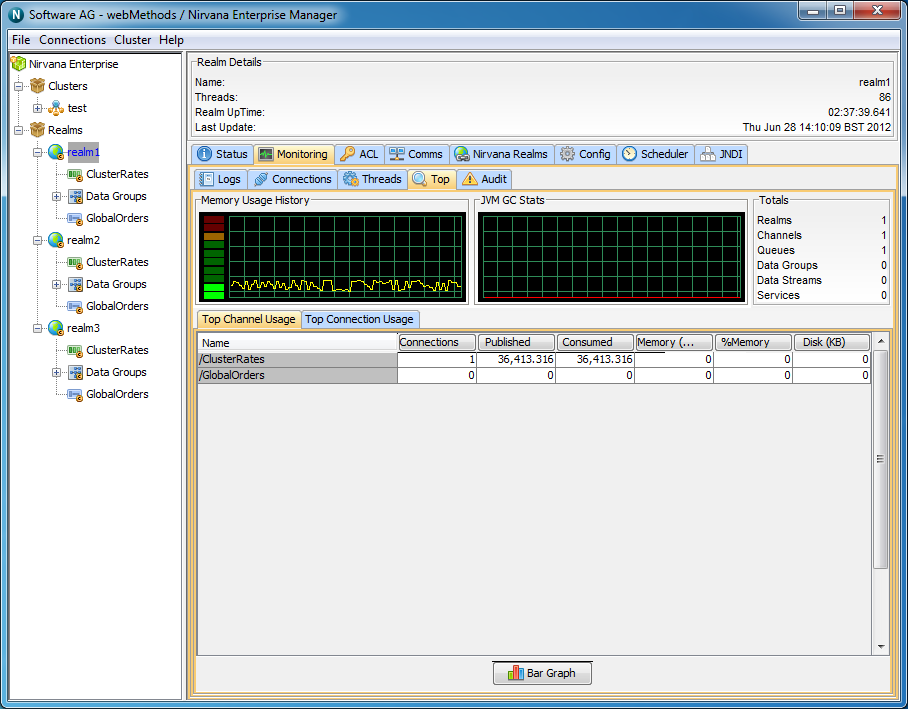
Within the 'Monitoring' panel of a selected Realm node you will find a panel called 'Top'. This provides a view not unlike 'top' for unix systems or task manager for windows based systems. Its main purpose is to present the user with a high level view of realm usage, both from a connection perspective and also from a channel perspective.
The Top panel comprises 2 sections. The top most section contains 2 real time graphs illustrating the realm memory usage in the same way the Realm Status panel (see
Realm Status) displays memory usage, as well as displaying JVM GC stats. This section also contains a summary showing the number of mounted realms, the number of resources and the number of services.
The bottom section of the Monitor panel displays a series of tabs, showing channel and connection usage throughout the realm.
Channel Usage
The middle section of the Monitor panel displays a table showing multiple columns and rows. This table represents channel usage throughout the realm. Each row in the table represents a channel. Channel usage can be measured a number of ways. Each measurement corresponds to a column within the table. By clicking on one of the column headers, all known channels will be sorted according to their value for the selected column. For example, one of the columns is 'Connections', i.e. the number of current consumers on the channel. By clicking on the column header labelled 'Connections', the table will be sorted according to the number of consumers each channel has. The channel with the most number of consumers will appear at the top of the table.
Channel usage measurements are described below:
 Connections
 - The number of consumers the channel has
Published - The rate of events published per status interval
Consumed - The rate of events consumed per status interval
Memory (bytes) - The number of bytes the channel uses from the JVM memory
% Memory - The percentage of overall JVM memory used by this channel
Disk - The amount of disk space used by this channel, only relevant for persistent / mixed channels
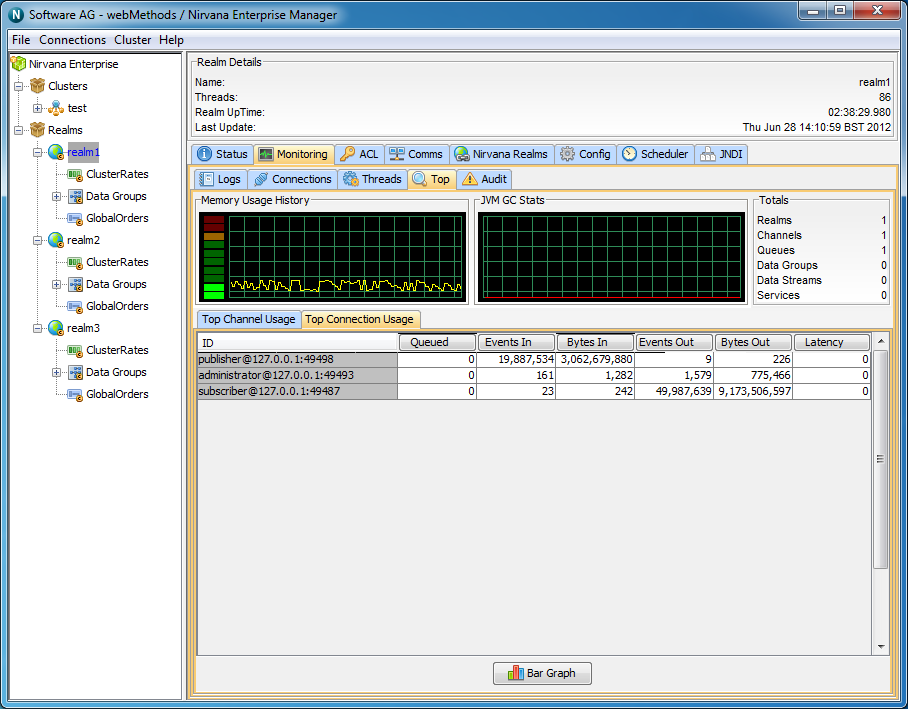
Connection Usage
The bottom section of the monitor panel shows a similar table to that of the channel usage table described above, except that this table represents connection usage. Each row represents a connection. A connection corresponds to the physical aspect of a Universal Messaging Session. Connection usage, like channel usage can be measured in a number of different ways. Each column in the table represents a type of measurement for a realm connection. Clicking on one of the column headers will cause the table of connections to be sorted according to the value of the selected column. For example, one of the columns is 'Events In', i.e. the number of events sent to the server by the connection. By clicking on the column header labeled 'Events In', the table will be sorted according to the number of events each connection has sent to the server. The connection with the most 'Events In' count will appear at the top of the table.
Connection usage measurements are described below:
Queued- The number of event in the connections outbound queue
Events In - The rate of events sent by the connection to the realm server
Bytes In - The rate of bytes sent by the connection to the realm server
Events Out - The rate of events consumed by the connection from the realm server
Bytes Out - The rate of bytes consumed by the connection from the realm server
Latency - The measured time it takes the connection to consume events from the server, i.e. time taken between leaving the realm server and being consumed by the connection.
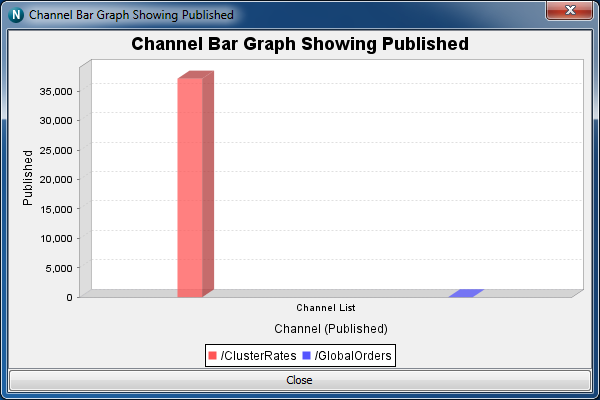
Monitor Graphs
The monitor panel provides a method of graphing both channel and connection usage. It uses a 3D graph package from
sourceforge (http://sourceforge.net/projects/jfreechart/) to display the items in each table as columns in a 3D vertical bar chart. The bar charts can be update live as the values in the tables are updated. Once a column is selected, simply click on the button labeled 'Bar Graph' under either the channel or connections table and a graph panel will appear, as shown in the image below showing a graph of the number of events published for channels within a realm..
Right-clicking anywhere within the graph will show a pop-up menu of options. One of the options is labeled 'Start Live Update', which will ensure the graph consumes updates as and when they occur to the table. Once the live update is started, you can also stop the live update by once again right clicking on the graph and selecting 'Stop Live Update'.
You can also print the graph, and save the graph image as a '.png' file, as well as alter the properties of the graph and its axis.