Queue Status
Every time a queue object is selected from the namespace, the first panel to be displayed on the right hand side of the Enterprise Manager panel is the 'Status' panel. Configuration information is always displayed at the top section of the Enterprise Manager when a queue is selected. This configuration information shows queue type, ttl (age) and capacity. The queue 'Status' tab shows real-time management information for the selected queue.
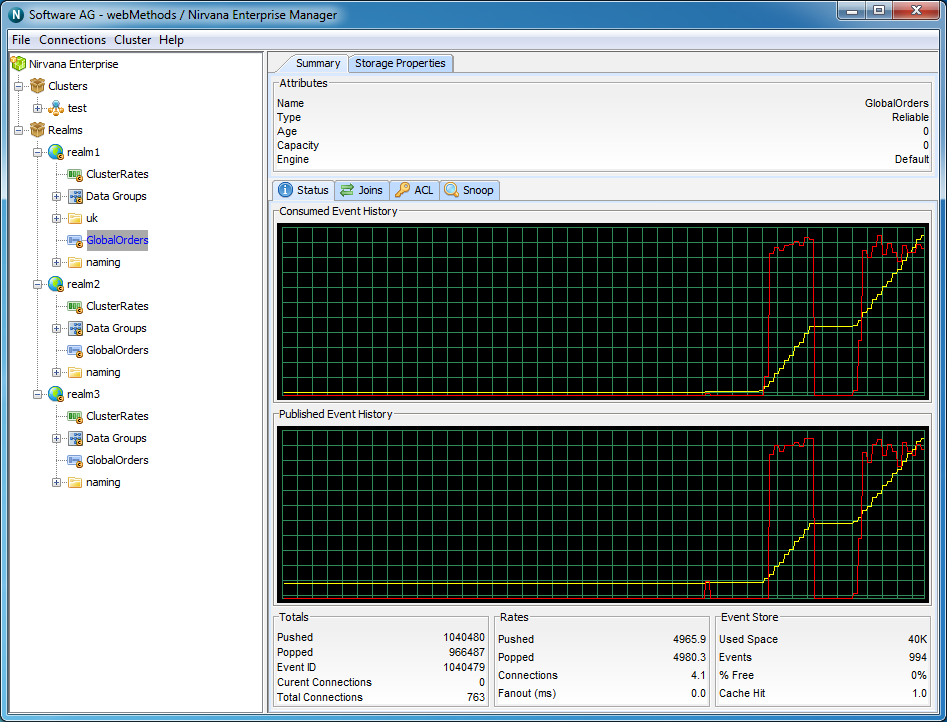
The status panel is split into 2 main sections. The top section shows real time graphs representing the events pushed and popped from the queue, both in terms of rates (i.e. per status interval) as well as the totals.
The bottom section shows the actual values plotted in the graphs for events pushed and popped, as well as information about the actual queue store at the server.
The image below shows the status panel for an active cluster queue.
The top most graph in the panel shows the event history for events popped from the queue. The red line graphs the rates at which events are being popped while the yellow line graphs the total events popped from the queue.
The bottom graph shows the event history for events pushed onto the queue. The red line graphs the rates at which events are being pushed while the yellow line graphs the total events pushed to the queue. As the status events are consumed, and the queue nLeafNode () is updated with the new values for events popped and pushed, the status panel and its graphs will be updated.
The bottom section of the status panel shows 3 types of information : Totals, Rates and Event Store. These are discussed below.
Totals
The totals section contains the following values:
 Published
 - The total number of events pushed to the queue when the last status event was consumed
Consumed - The total number of events popped from the queue when the last status event was consumed
Event ID - The event id of the last event pushed to the queue
Current Connections - The current number of asynchronous consumers on the queue
Total Connections - Total number of asynchronous consumers that have subscribed to the queue
Rates
The rates section contains the following values:
Published - The current rate of events pushed to the queue, calculated as (total - previous total) / (interval 1000 milliseconds)
Consumed - The current rate of events popped from the queue, calculated as (total - previous total) / (interval 1000 milliseconds)
Connections - The current rate of asynchronous subscriptions being made to the queue
Event Store
The event store section contains the following values:
Used Space - The amount of space in KB used by the queue on the server (either memory, or disk for persistent / mixed queues)
Events - The current number of events on the queue
% Free - The amount of free space in the queue store (calculated as (used space - (total space used by all purged or aged events))
Cache Hit - The %age of events popped from the queue event cache as opposed form the actual physical store if persistent or mixed