Data Group Status
When you select the 'Data Groups' node from the tree, one of the available panels to select is labeled 'Status' panel.
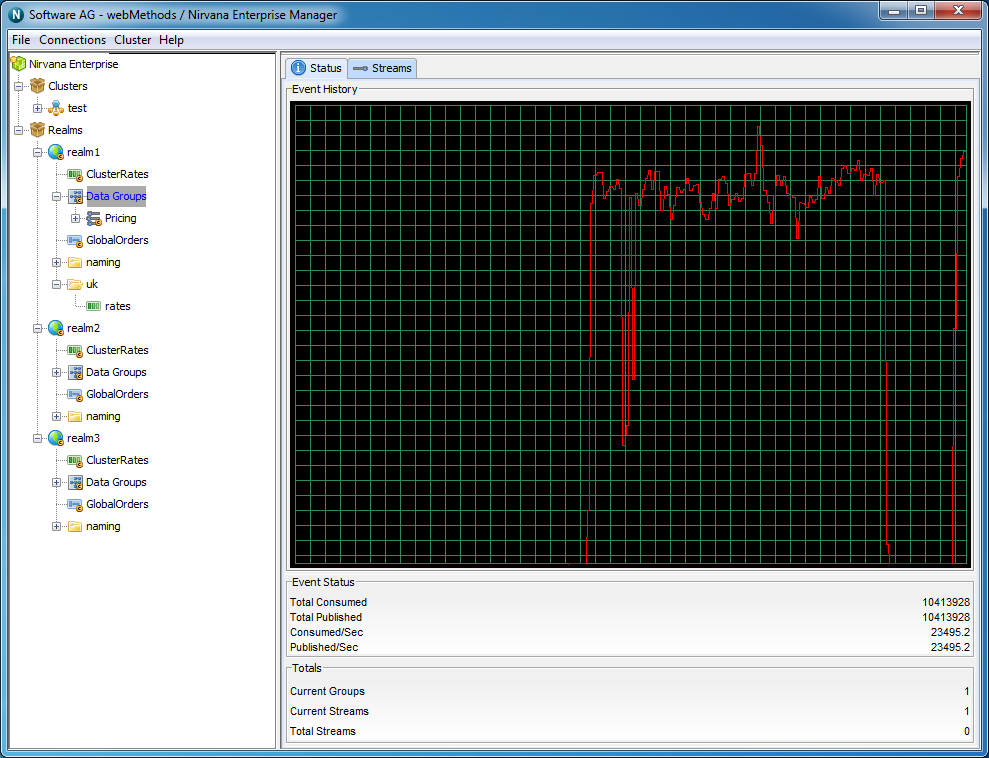
The Status panel for The 'Data Groups' node contains information regarding the publish and consumed events on Data Groups as well as the number of Data Groups and Data Streams currently connected
The status information shown within this panel is explained below.
The Status panel is split into 2 main sections. The top most section of this panel shows a graph that demonstrates Event History
The event history graph shows the rates that events are published (red) and consumed (yellow) across all data groups in the current realm.
This graph is updated every time a status event is received from the realm in which data groups are actively being used. The image below demonstrates the status graphs as described.
The bottom section of the panel displays 4 sections of information, Event Status, Totals, Connection Status and Storage Usage respectively. These panels and the information displayed are described below.
Event Status
The Event Status section describes the following :
 Published
 - The total number of events published to all channels, queues and services within the container
Consumed - The total number of events consumed from all channels, queues and services within the container
Published/Sec - The number of events published to all channels, queues and services, per second within the container
Consumed/Sec - The number of events consumed from all channels, queues and services, per second within the container
Totals
The Totals section describes the following :
Realms- The number of realms mounted within this container
Channels- The number of channels that exist within this container
Queues- The number of queues that exist within this container
Services- Total number of services that exist within this container
Connection Status
The Connection Status section describes the following :
Total - The total number of connections made to channels, queues and services within this container
Current - The current number of connections made to channels, queues and services within this container
Rate - The number of connections being made per second to channels, queues and services within this container
Storage Usage (KB)
The Memory Usage section describes 4 values :
Total - The total amount of KB used by channels, queues and services found within this container
Free - The free memory available in the Realm JVM
Used - The amount of memory available in the Realm JVM
Change - The amount of change in Realm JVM memory between newest update and previous update