Dashboard for End-to-End Monitoring
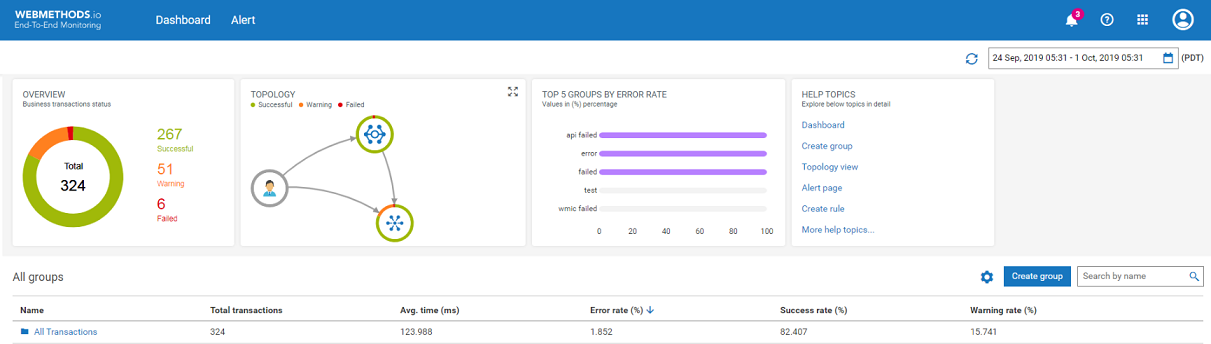
The dashboard for End-to-End Monitoring gives you a collective view of all the business transactions carried out within your cloud platform. The default Dashboard view includes the transaction widgets and the default All Transactions group. The All Transactions group contains all the transactions within the application and cannot be deleted.
Note: When you perform sorting, the All transactions group remains on the top of the list.
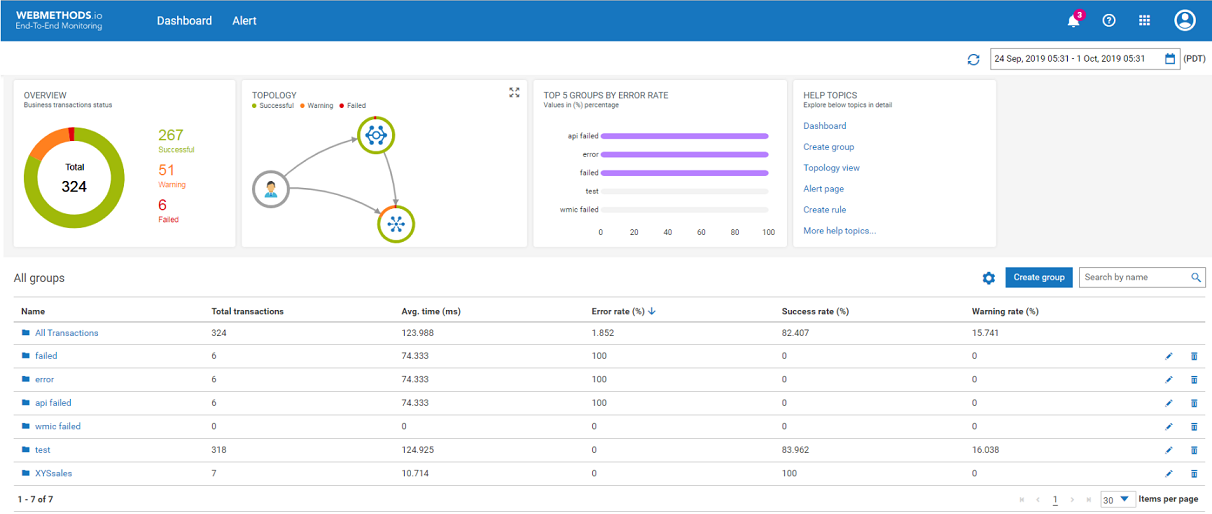
An example of the dashboard that includes custom groups created by an end user is as follows:


- An alert icon to notify you of any new transaction notifications.

- User help that includes the help content for this application.

- Use the link provided here to log off from the application.
Time range - Below

is the drop-down list for time range selection. By default, it is set to half an hour prior from the current system time. For example, if current system time is 3:30 PM, then the time range shows as 3 PM to 3 30 PM. Click

next to the time range to select a specific duration.
Note: The time zone is set automatically based on the system time.
Transaction widgets - Following widgets are available on the dashboard:
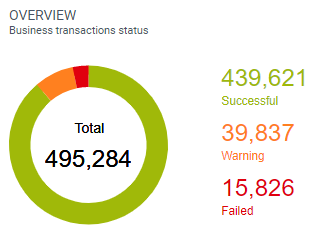
Overview - This is a pie chart that provides you a summary of all the transactions processed based on the following parameters:
Failed
Warning
Successful
An example of the Overview widget is as follows:
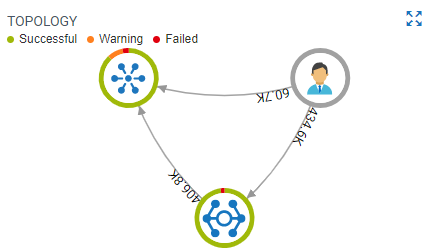
Topology - This is a graphical representation of all the transactions across all the supported nodes. It shows the transactions flowing through each runtime as well as the status of each runtime for the selected time range.
An example of the Topology widget is as follows:
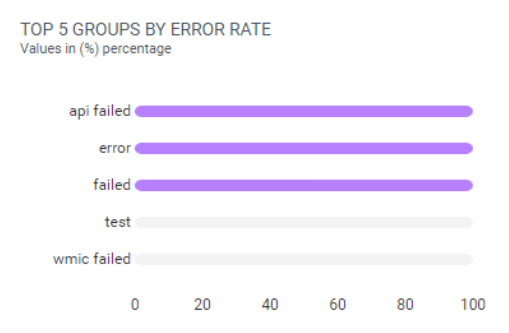
Top 5 Groups by Error Rate - This is a graphical representation which shows the top 5 groups based on the error rate. The values are displayed in percentage. The
All Transactions group is excluded from this widget. An example of this widget is as follows:
Help Topics - This provides you quick access to the help content for some of the commonly used topics.
All groups - This lists all the transaction groups you create using the application and also the default
All Transactions group. At the group level, you can see the following parameters for the selected time range:
Note: You can customize the parameters to view by clicking

next to
Create Group.
Name - Name of the group.
Total transactions - The total number of transactions for each group.
Avg. time (ms) - Average time of execution for all the transactions within a group.
Error rate (%) - The rate of error in percentage for all the transactions within a group.
Success rate (%) - The rate of success in percentage for all the transactions within a group.
Warning rate (%) - The rate of warning for all the transactions within a group.
Search by name - Search for a transaction group by typing its name in the search box.