Time Period | Details |
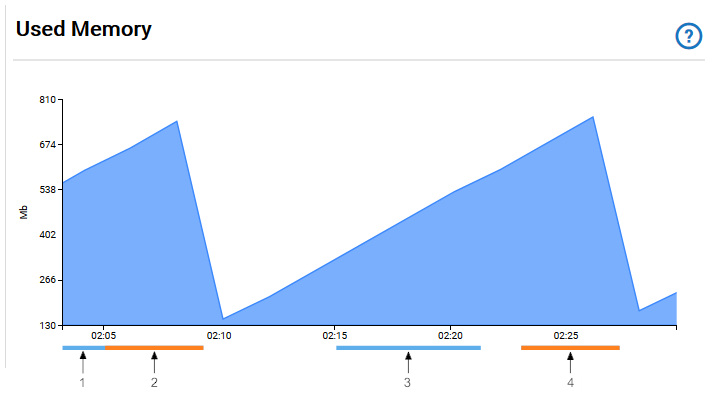
1 | Until 2:05 h, there had been an open information alert. |
2 | At 2:05 h, the severity of the information alert was changed to warning. |
3 | An information alert existed during that period. |
4 | A warning alert existed during that period. |
Name | Description |
Used Memory | The total used memory for the Java VM. |
Service Threads | The number of active service threads. |
Sessions | The number of active licensed sessions. |
Stateful Sessions | The number of the current stateful HTTP sessions. |
Name | Description |
Free Memory | The amount of free memory that the Realm Server has within the Java VM. This indicates the difference between what the Java VM has currently allocated and what the Realm Server has used. |
Published Events | Total number of events published on this realm from the time it started. |
Subscribed Events | Total number of events that this realm has sent to clients from the time it started. |
Name | Description |
Off-Heap Used Memory | Shows the amount of off-heap memory that is currently used. |
Live Objects | Shows the total number of live objects in the cluster, mirror group, server, or clients. If the trend for the total number of live objects goes up continuously, clients in the cluster will eventually run out of memory and applications might fail. Upward trends indicate a problem with application logic, garbage collection, or the tuning of one or more clients. |