Creating a trend chart
To create a trend chart, you add it to a dashboard and set its traceCount property to the number of trace lines you want to display. This will cause a set of properties to be added to the property panel for each trace; trace1 through traceN. Following are the properties for trace1.
Each trace will have a traceNValue and traceNValueTable property. These define the data attachment for the traces. The traceNValue property is used to attach the trace to new data (data received after the time of attachment). The traceNValueTable property is used to attach the trace to historical data (data received before the time of attachment).
When attaching a trace to an instance variable, you must specify a filter that identifies the instance the trace will show data for. The filter to identify the instance will typically match on $instanceId although other filters can also be used.
The Trend Drilldown tutorial sample demonstrates how to use a trend chart where the instance charted is determined by the selection in an instance summary table.

To recreate this sample, create a new dashboard and perform the following steps
1. From the Tables tab in the Object Palette, select the Table object and add it to the dashboard canvas.
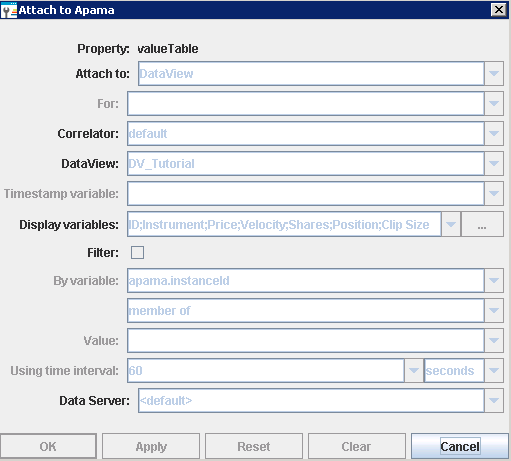
2. With the table object selected, in the Object Properties panel, double-click the valueTable property and attach it to Apama by specifying the information shown below in the DataView and Display variables fields. Do not apply a filter.
3. From the Trends tab in the Object Palette, select the Single Variable Trend object and add it to the dashboard canvas.
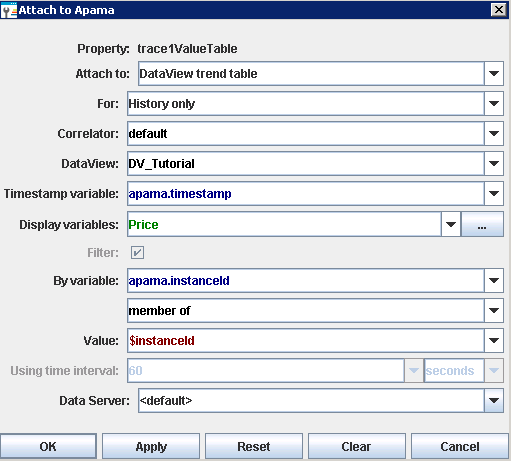
4. With the trend object selected, in the Object Properties panel, double-click the trend chart object's trace1ValueTable property and attach it to the trend table for the tutorial DataView by specifying values in the fields as shown below.
Here the Price variable is selected for the trace. The DataView item charted will be the selected instance as indicated by the variable $instanceId.
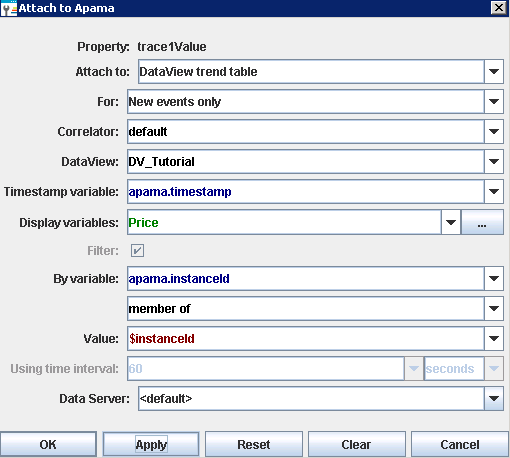
5. With the trend object selected, in the Object Properties panel, double-click the trend chart object's trace1Value property and attach it to the trend table for the tutorial DataView by specifying values in the fields as shown below.
Here the Price variable is selected for the trace. The DataView item charted will be the selected instance as indicated by the variable $instanceId.
6. Select the trend object's scrollbarMode property and change its value to As Needed. This will add a scrollbar to the chart allowing you to scroll back in time to view earlier values.
7. Select a DataView item in the table by double-clicking on it. The chart will now begin charting the Price variable of the selected DataView item.
If you have not previously displayed a sample containing a trend chart, no previous values for Price will be displayed. Apama does not collect data in a DataView trend table until the first attachment to an instance of the table is made.