Creating a stock chart
To create a stock chart, you add it to a dashboard and attach its priceTraceHistoryTable property to OHLC data for an instance. The filter to identify the instance will typically match on $instanceId although other filters could also be used.
The Stock Chart Drilldown tutorial sample demonstrates how to use a stock chart where the instance charted is determined by the selection in an instance summary table.

To recreate this sample create a new dashboard and perform the following steps
1. From the Table tab in the Object Palette, select the Table object and add it to the dashboard canvas.
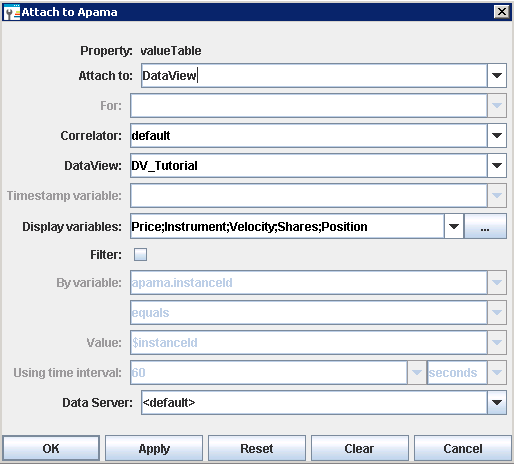
2. With the table object selected, in the Object Properties panel double-click the table object's valueTable property and attach it to Apama and select the tutorial DataView. Select the display variables shown in the example and do not apply a filter. The information should be specified as follows:
3. From the Trends tab in the Object Palette, select the Stock Chart object and add it to the dashboard Canvas.
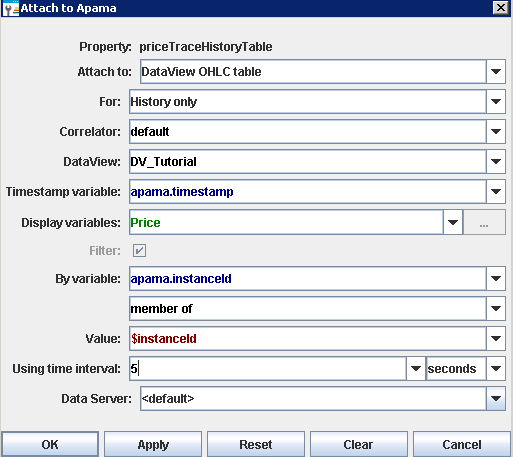
4. With the stock chart selected, in the Object Properties panel, double-click the priceTraceHistoryTable property. Attach it to the OHLC table for the tutorial DataView and specify the rest of the information as shown in the following illustration. Here the Price variable will be charted over 5 second intervals. The instance charted will be the selected instance as indicated by the variable $instanceId
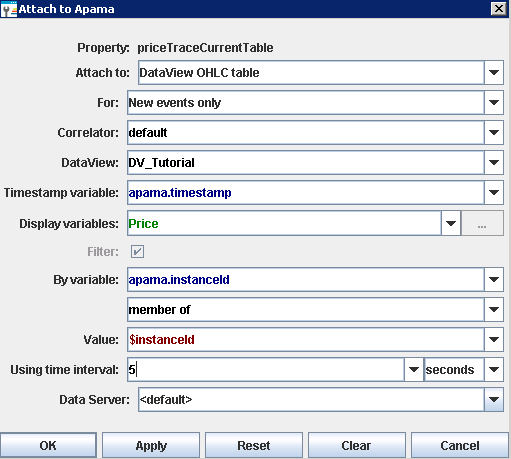
5. With the stock chart selected, in the Object Properties panel, double-click the priceTraceCurrentTable property. Attach it to the OHLC table for the tutorial DataView and specify the rest of the information as shown in the following illustration. Here the Price variable will be charted over 5 second intervals. The instance charted will be the selected instance as indicated by the variable $instanceId.
6. Select the timeRange property and set its value to 60.0. This will set the chart's time axis such that 60 seconds of data will be visible. If you set the value too high you may encounter problems where the “sticks” of the chart are close and overlap.
7. Select the scrollbarMode property and change its value to As Needed. This will add a scrollbar to the chart allowing you to scroll back in time to view earlier values.
8. Select an instance in the table by double-clicking on it. The chart will now begin charting OHLC values for the Price variable of the selected instance.
If you have not previously displayed a sample containing a stock chart, values in the chart will not appear for ten seconds. Apama does not collect data in an instance OHLC table until the first attachment to an instance of the table is made.