Trend charts
Trend charts provide the ability to view the performance of one or more DataViews items over time.
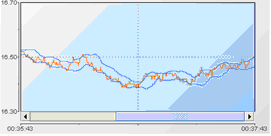
Trend chart
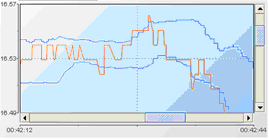
If enabled in the Dashboard Builder, trend charts support the ability to zoom in on an area of the chart. To zoom in on an area of a trend chart, click on the chart and drag the pointer to draw a box around the area to be zoomed.
Zooming in a trend chart area
To zoom out of a chart, hold down the Shift key while clicking on the chart.
If enabled in the Dashboard Builder, trend charts support scrolling to view historical values outside the scope of what fits in the trend chart window. Use the horizontal scroll bar to view older values.
The number of values stored in historical data is limited. The limit is defined in the
OPTIONS.ini file and can be overridden at startup by specifying options as detailed in
Startup Options for the Dashboard Viewer.
When the maximum number of values is reached, the Dashboard Viewer begins to remove the oldest values in order to make room for the newest values. When the maximum number of values is reached, you see the oldest values being removed from the end of the trend chart.