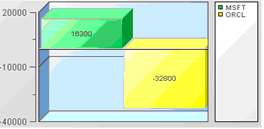
Pie and Bar charts
Pie and Bar charts are typically used to display summary information about one or more instances.
If enabled in the Builder, a pie or bar chart may also support drilldown to display detailed information about an instance. To drill down on an instance or item that is displayed in a pie or bar chart, click on it.