The model editor allows you to create analytic models graphically. It is invoked when you add or edit a model in the model manager. See also
Adding a new model and
Editing an existing model.
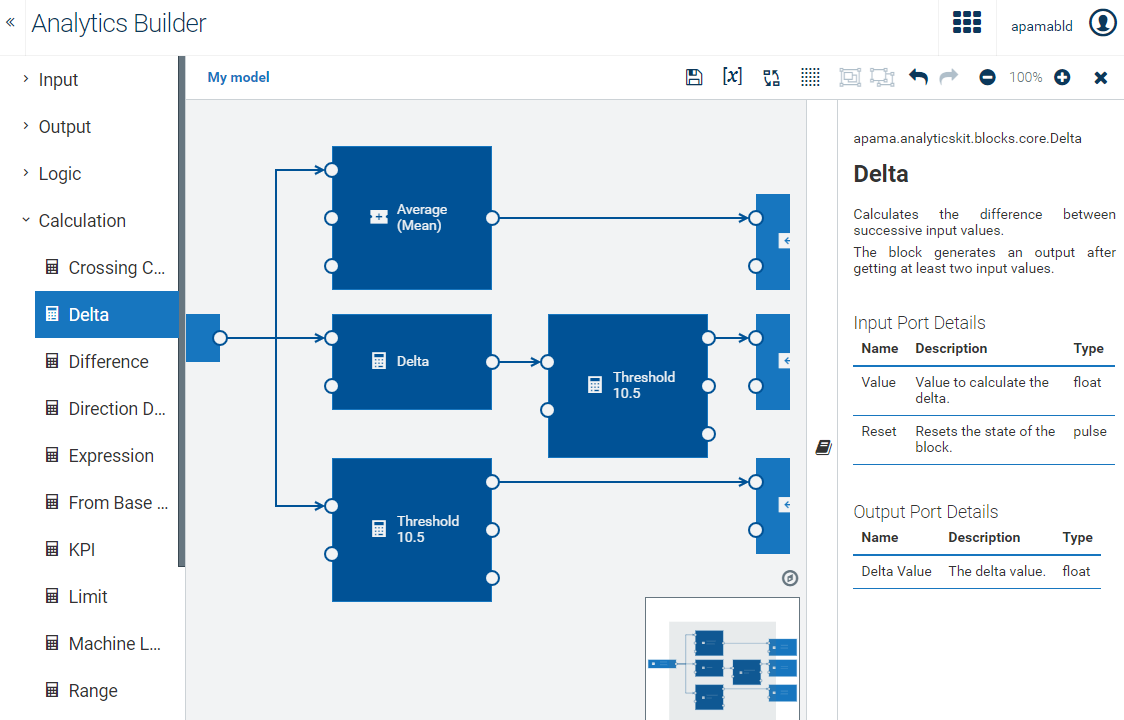
The palette on the left contains the blocks that you can add to your model. It has several expandable/collapsible categories for the different types of blocks.
The canvas in the middle is the area in which you
draw your model. You drag the blocks from the palette onto the canvas, specify the parameters for the blocks, and wire the blocks together. The content of the canvas is aligned to a grid (see also
Showing and hiding the grid).
The overview area at bottom right of the canvas shows the entire model. This is helpful if your model is too large to fit on the currently visible area of the canvas. See also
Navigating large models.
The documentation pane on the right allows you to view reference information for the currently selected block. See also
Viewing the documentation for a block.
CAUTION:
Changes are only saved when you click

(see also
Saving a model). The editor warns you if you attempt to navigate away from the editor and there are unsaved changes, however, you should always ensure that your changes are saved before disconnecting the browser from the network or suspending a laptop.