First steps: Creating your first model
This topic gives a brief overview of how to add and design a new model, and how to view its output. It is not intended to be a comprehensive description of the full range of possibilities provided by Analytics Builder. Therefore, explanations are kept to a minimum. For more detailed information, see the remainder of this documentation.
The steps below require that a device has already been registered in
Cumulocity IoT. Preferably, this is a device which is already sending measurement values to
Cumulocity IoT. This can be, for example, a smartphone on which the Cumulocity IoT Sensor App has been installed (see
Cumulocity IoT Sensor App in the
Cumulocity IoT documentation for detailed information).
The model that you add will contain three blocks:

An input block which receives measurement values from a device.
A block that calculates the mean of the measurement values over time.
An output block that sends the calculated mean values to
Cumulocity IoT's Device Management application so that they can be viewed there.
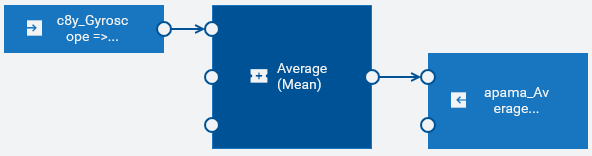
When you have completed all steps below, your model will look similar to the following:
Step 1: Log on to Cumulocity IoT and switch to Analytics Builder
You access
Cumulocity IoT via a web browser. See
Getting Started in the
Cumulocity IoT documentation for detailed information.
1. Ask your administrator for the URL that is required to start Cumulocity IoT.
2. Enter your user name and password in the login screen.
3. In the top bar of the
Cumulocity IoT user interface, click the application switcher button (

) and then click
Streaming Analytics.
4. On the home screen of the Streaming Analytics application, click the Open button that is shown below the Analytics Builder heading.
Or click Analytics Builder in the navigator.
Step 2: Add a new model
The first page that is shown when you invoke Analytics Builder is the model manager.
1. In the toolbar of the model manager, click New model.
2. In the resulting dialog box, enter a model name and click OK.
Step 3: Add the input block
You design your model in the model editor. The model editor is shown after you have entered the model name. The palette which is shown on the left contains all blocks that can be added to a model. You add a block by dragging it from the palette onto the canvas. The blocks for the input devices that have been registered in Cumulocity IoT are shown under Input.
1. Drag the input block for your device onto the canvas.
The block parameter editor is automatically shown. The block type of an input device is Measurement Input by default. We will use this default setting.
2. Select the fragment and series for which the input block is to listen.
If the device has previously sent data, the drop-down list box offers one or more values for selection. An example for the Cumulocity IoT Sensor App would be c8y_Gyroscope => gyroY.
3. Select the Ignore Timestamp check box.
This makes sure that the measurements are processed in the same order as they are received.
If you need detailed information on the currently selected block, view the block reference in the documentation pane on the right. If the documentation pane is currently not shown, click

.
Step 4: Add the block that calculates the mean of the measurement values
1. In the palette, expand Aggregates.
2. Drag the Average (Mean) block onto the canvas.
3. In the block parameter editor, specify a value for Window Duration (secs), for example "10".
The specified number of seconds will be used to control what duration the measurement is averaged over. Smaller values will react quicker to changes in values, larger values will give more smoothing of the value.
Step 5: Add the output block
1. In the palette, expand Output.
2. Drag the output block for your device (that is, a block with the same name as your input block) onto the canvas.
3. Specify "apama_Average" as the fragment name.
4. Specify "value" as the series name.
Step 6: Connect the blocks
To pass the values from one block to another, you have to connect the blocks with wires. You attach the wires to the ports, that is, to the small circles that are shown to the left and/or right of a block.
1. Click the Value output port of the input block and drag the mouse to the Value input port of the Average (Mean) block.
2. Click the Average output port of the Average (Mean) block and drag the mouse to the Value input port of the output block.
Step 7: Save the model and go back to the model manager
1. In the toolbar of the model editor, click

to save your newly created model.
2. In the toolbar of the model editor, click

to leave the model editor and thus to return to the model manager.
Note:
Only saved models are listed in the model manager. When you add a new model and then leave the model editor without saving the model, it will not be listed in the model manager, and all the edits you made will be lost.
Step 8: Activate the model in production mode
A card for the newly added model is shown in the model manager. A new model is automatically set to draft mode and inactive state. You will now activate your new model in production mode. This deploys the model so that the measurements from your device are processed.
1. Click the drop-down menu on the card which currently shows Draft and select Production.
2. Click the toggle button on the card which currently shows Inactive. This changes the state to Active.
Step 9: Go to the Device Management and view the measurements
To view the measurements that are sent from your active model, you have to switch to
Cumulocity IoT's Device Management application. See
Device Management in the
Cumulocity IoT documentation for detailed information.
1. Click the application switcher button (
) and then click
Device management.
2. In the navigator on the left, click Devices and then All devices.
3. Locate your device and click its name to display the device details.
4. Click Measurements on the left. This is a dynamic tab which is only shown when measurements are available for the device.
The resulting page shows several charts, visualizing the data sent from your device. It should now also show a chart titled "Apama_average" in which you can view the values that are sent from your newly created model. You may have to reload the page to see this new chart. See
Measurements in the
Cumulocity IoT documentation for more information on the
Measurements tab.