
The following topics are covered below:
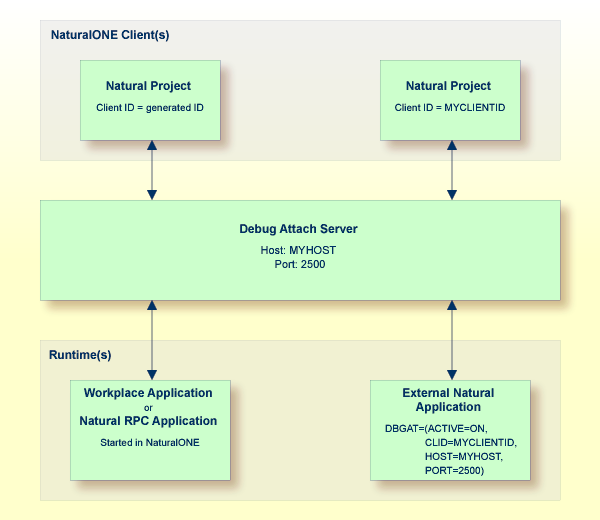
The debug attach server is required in order to debug Natural RPC applications, external Natural applications, and workplace applications (that is, Natural for Ajax pages of type MFPAGE). The debug attach server acts as a broker between the NaturalONE clients and the attachable sessions. It enables the NaturalONE debugger to attach to a running application and links the debugger with the appropriate Natural runtime.
The debug attach server must be accessible to all NaturalONE clients and to all executing Natural sessions that you want to participate in debugging.
The debug attach server is available for Windows and Linux. It is delivered with the local Natural runtime of NaturalONE and with Natural for Windows version 6.3.13 and higher and Natural for Linux version 9.3.2 and higher.
The following section describes how to prepare your NaturalONE client and Natural runtime for debugging:
Preparing the NaturalONE client
To enable debugging for a NaturalONE client, you must enable the debug attach
server in the Natural-specific Preferences of NaturalONE and specify the appropriate
settings (host name and port number). You can also enable SSL/TLS security in the
Preferences dialog box. For details about the debug attach settings, see Debug Attach Settings in
Setting the Preferences.
Your Natural project must contain all the relevant sources for the application that you want to debug. For example, you can download the sources from a Natural server into a Natural project, or you can check out the sources from your version control system.
A Natural source is registered on the debug attach server if it contains a breakpoint. You have to set at least one breakpoint in the source with which you want to start your debug session.
When you debug an application from within NaturalONE (a workplace application or Natural RPC application), the sources containing the breakpoints are automatically registered.
If you want to debug an external Natural application (an application that is started, for example, with Natural for Windows), you have to register the sources containing the breakpoints explicitly using the command .
Starting the Natural runtime in debug attach mode
You must start the Natural runtime you want to debug in debug attach mode.
When you debug an application from within NaturalONE (a workplace application or Natural RPC application), this mode is set automatically.
If you want to debug an external Natural application (an application that is
started, for example, with Natural for Windows), you have to set the debug attach
mode explicitly using the Natural profile parameter
DBGAT.
At runtime, when a registered breakpoint is hit during the execution of the application, a debugging session for the corresponding Natural runtime is launched and you can debug as described in Debugging Natural Applications.
All Natural objects that have been registered for a specific client are automatically removed from the debug attach server when you exit NaturalONE.
Note
The debug attach server uses a client ID to manage its attach records. Software AG
recommends that you always use the unique client ID that is automatically generated.
However, if you want to debug an external Natural application or, if necessary for
testing purposes, you can manually define a custom client ID in the properties of a
project. See Debug Attach
Settings in Changing the Project
Properties.
The following sections describe how to debug Natural RPC applications and external Natural applications. For information on how to debug workplace applications, see Executing and Debugging Workplace Applications in the Natural for Ajax documentation.
It is not required that each NaturalONE client starts its own debug attach server. It is sufficient to start one debug attach server which can be accessed by all NaturalONE clients, even if the clients run on different machines. It is only required that all NaturalONE clients define the appropriate debug attach settings in the Natural preferences.
The debug attach server program is called natdas and is located in the
\naturalone\natrun\bin folder of your NaturalONE
installation.
The syntax to start the debug attach server is the following:
natdas [-p port-number] [-o file-name] [-c] [-ssl/-tls]
where port-number is the number of the listener
port and file-name is the name of your trace
file. -c prints the log output in the command line. If you want to use this
program with SSL/TLS, specify the server certificate and key file as
das.server.cert.crt and das.server.cert.key. The certificate
and key file must be stored in PEM format in the location of the natdas binary.
-ssl and -tls are interchangeable.
If you do not specify any parameters when starting the debug attach server, the program
uses the default port 2500.
If you want to use a port other than the default port, or if you want to create a trace file, you have to specify additional parameters. For example:
natdas -p 9999 -o c:\temp\natdas.log
If you want to start the debug attach server using a Windows shortcut, you can specify the parameters as shown in the following example:
D:\SoftwareAG\NaturalONEnn\naturalone\natrun\bin\natdas.exe -p 9999 -o c:\temp\natdas.log
When you specify that a trace file is to be created and if a trace file with the same name already exists, the existing file is overwritten.
A Natural RPC application switches to a different Natural runtime environment.
The following steps assume that you have already created a Natural
project containing the relevant sources for the Natural RPC application in
NaturalONE (for example, a main program which invokes two subprograms using the
CALLNAT statement).
 To debug a Natural RPC application
Open the source editor for one of the subprograms which is invoked by the main program and set at least one breakpoint.
In the Project Explorer view or in the Natural Navigator view, select the main program.
Invoke the context menu and choose .
Or:
Press ALT+SHIFT+D, N.
Or:
The main program is now started in debug mode. You can use the Debug perspective as described in the section Debugging Natural Applications.
When the first breakpoint which has been set in the subprogram is reached, the main debugging session turns into wait state. Since the RPC is executed on a different machine, a new debugging session is launched and debugging stops on the breakpoint.
With , you return to the debugging session for the main program.
If you want to debug a Natural application that is started outside
of NaturalONE (for example, a batch application which is started with Natural
for Windows or Linux), you have to start the application using the Natural
profile parameter DBGAT. This parameter specifies the
client ID to be used, and the name and port of the debug attach server. For
detailed information, see the description of the DBGAT
parameter in the Natural documentation for the appropriate platform.
The following steps assume that you have already created a Natural project containing the relevant sources for the Natural application in NaturalONE.
To debug an external Natural application
Open the source editor for a Natural program which belongs to the application and set at least one breakpoint.
In the Project Explorer view or in the Natural Navigator view, select the Natural project.
Invoke the context menu, choose and then specify a custom client ID. See also Debug Attach Settings in Changing the Project Properties.
Invoke the context menu for the Natural project once more and choose .
This command registers the existing breakpoints in the debug attach server.
Note
This command is only visible when the debug attach server
has been enabled in the Natural preferences.
Go to your external Natural application and start it using
the DBGAT parameter.
Important
The parameters for the host name and port number
that have been specified for the external Natural application using the
DBGAT parameter must be the same as defined in your
Natural preferences. The client ID that has been specified with the
DBGAT parameter must be the same as in your project
properties.
When the program in which the breakpoint has been set is about to be executed inside the corresponding Natural session, the debugger is launched and the application stops at the first breakpoint. You can now use the Debug perspective as described in the section Debugging Natural Applications.
If you do not want to continue debugging, you have to remove the application from the debug attach server. To do so, select the Natural project, invoke the context menu and choose .
Note
If you do not choose the above command, the application
is automatically removed from the debug attach server when you exit NaturalONE.
