
This section describes the SYSUTIL utility, the rich GUI interfaces of the SYSEXT, SYSEXV, and Natural Profiler utilities and the Message Retrieval utility.
This document covers the following topics:
The SYSUTIL utility is used to start selected Natural tools and utilities from NaturalONE. It may also be used to start user-defined tools. The tools are executed on the server side whereby any kind of server (mainframe, UNIX, Windows) is supported.
In addition to that, it can be used to open web pages from NaturalONE.
For technical reasons, only rich GUI (Natural Ajax) and character-based tools are supported.
Tools using the dialog interface are not supported.
Tools which are implemented in NaturalONE such as SYSPROD or
SYSPROF, are not provided by SYSUTIL. If you want to execute such a tool, you
can enter the corresponding command in the Command field or add it
to the user defined tools as described in
Extend the List of
Tools and Utilities.
Web I/O must be enabled on the Natural server. Otherwise, the output of a character-based tool cannot be displayed.
The PARSE XML statement must be
enabled in a mainframe environment. Use the following parameter:
XML=(ON,PARSE=ON)
For further information, see the XML
parameter description in the Parameter Reference section
of the Natural for Mainframes documentation.
On non-mainframe environments, the
PARSE statement is enabled by default.
Natural Version 9.1 or higher is required on the server side to run the Natural tools and utilities from NaturalONE. Otherwise, you will receive a message like:
NAT0082 Invalid command, or Program SYSUTIL does not exist in library.
 To start the Natural tools and utilities
In your workspace, select the Natural project, library or object from which you want to start the Natural tools and utilities.
Invoke the context menu and choose NaturalONE > Tools and Utilities.
Or:
Press Alt+U.
This starts the SYSUTIL utility from which you can start selected Natural tools and utilities.
The SYSUTIL utility lists Natural tools and utilities which can be executed from NaturalONE.
If Natural Security is installed in your environment, the list only displays tools you are authorized to use.
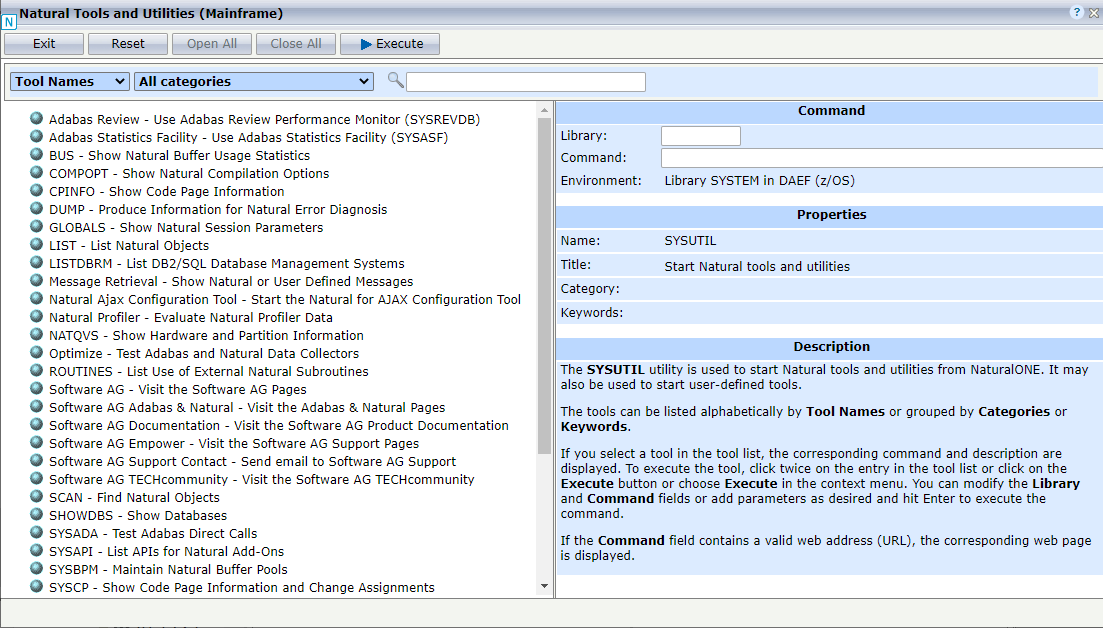
The tools can be listed alphabetically by Tool Names (default) or grouped by Categories or Keywords. By default, the list shows the tools of all categories. A specific category can be selected so that only tools belonging to this category are listed.
You can specify a search string so that only the tools containing the string in the name, title, category, or a keyword are shown.
If you click on the help icon (![]() ) in the upper right corner of the page, help
information is provided.
) in the upper right corner of the page, help
information is provided.
The buttons in SYSUTIL have the following meaning:
| Button | PF Key | Description |
|---|---|---|
| Exit | F3 | Exit SYSUTIL. |
| Reset | F5 | Reset all fields to their initial state. |
| Open All | Open all nodes in the tree. Only enabled if the tree is grouped by categories or keywords. | |
| Close All | Close all nodes in the tree. Only enabled if the tree is grouped by categories or keywords. | |
| Execute | F9 | Execute a selected tool. Works only if a tool has been selected or a command has been specified. |
The entries on the right side of SYSUTIL have the following meaning:
| Entry | Description |
|---|---|
| Library | SYSUTIL issues a LOGON to this library before it executes the command. If no library is specified, the command is executed in the library from where SYSUTIL has been started. |
| Command | The command or program to be executed. If the field contains a valid web address (URL), the corresponding web page is opened in a new window. |
| Environment | The environment from where SYSUTIL has been started. |
| Name | The name of the tool. |
| Title | The descriptive name of the tool. |
| Category | The category to which the tool belongs. |
| Keywords | Keywords associated to the tool. |
| Description | A short description of the functionality of the tool. |
To start a specific Natural tool or utility
Select a tool in the SYSUTIL tree. The Library and Command fields are filled according to your selection.
Add parameters to the command as desired.
Click on Execute.
Or:
Double-click the tool entry in the SYSUTIL tree.
Or:
Select a tool in the SYSUTIL tree.
Invoke the context menu and choose Execute.
Or:
Specify a library and a command (including parameters if desired) in the corresponding fields.
Press Enter or click on Execute.
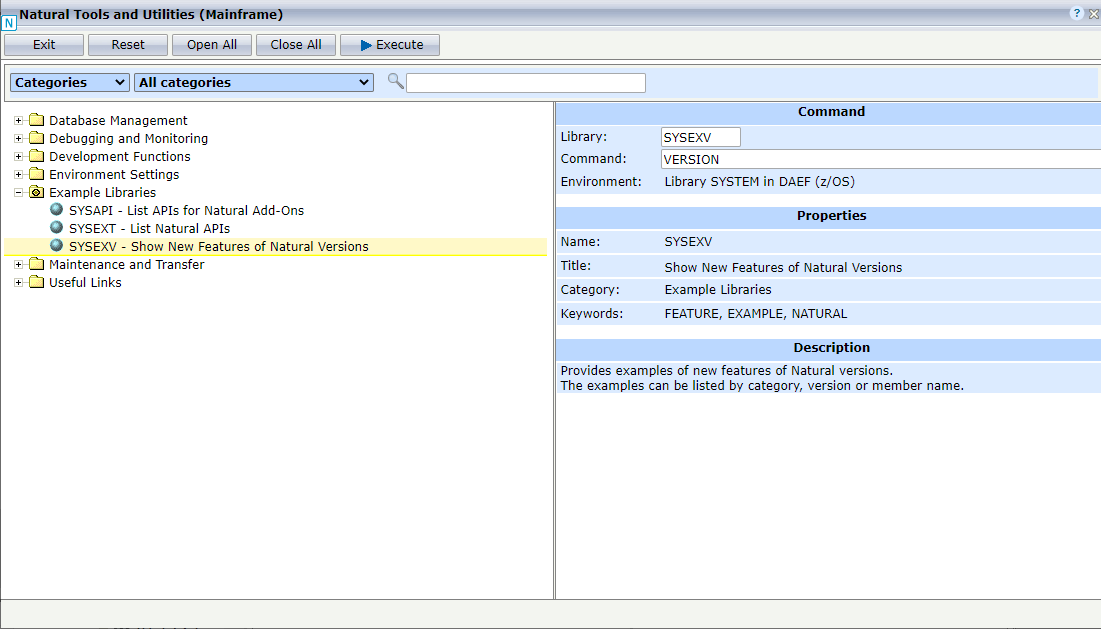
In the following example, the Natural tools and utilities are grouped by categories and the SYSEXV utility in the Example Libraries category has been selected. The entries on the right side are filled with the values of the SYSEXV utilities. The utility will be started by clicking on .
The utility SYSEXT is used to locate and test Natural Application Programming Interfaces (APIs) contained in the current system library SYSEXT.
This section describes the rich GUI interface to SYSEXT from NaturalONE. For further information regarding the SYSEXT utility, refer to the section SYSEXT Utility in the Natural documentation corresponding to your platform.
To start the SYSEXT utility
In your workspace, select any Natural project, library or object in the environment in which you want to start the SYSEXT utility.
Invoke the context menu and choose NaturalONE > Tools and Utilities to start the SYSUTIL utility.
Select SYSEXT in the tree and click on .
The rich GUI interface of the SYSEXT utility is displayed.
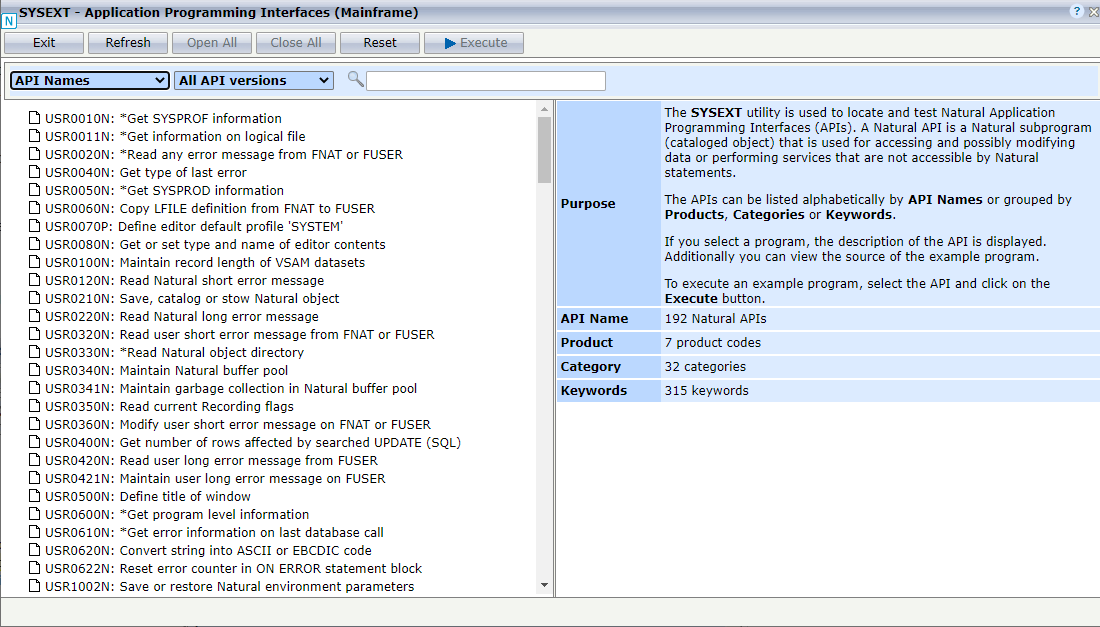
The Natural APIs can be listed alphabetically by API Names (default) or grouped by Products, Categories or Keywords. By default, the list shows all versions of the APIs whereby previous versions of an API are indicated by an asterisk (*). If you want to see only the most recent version of an API in the list, select Current API version.
You can specify a search string so that only the APIs containing the string in the name, purpose, category, or a keyword are shown.
If you click on the help icon (![]() ) in the upper right corner of the page,
help information is provided.
) in the upper right corner of the page,
help information is provided.
The buttons in SYSEXT have the following meaning:
| Button | PF Key | Description |
|---|---|---|
| Exit | F3 | Exit SYSEXT. |
| Refresh | Update the API information. It reads all APIs and regenerates the input files which are used to fill the tree. This is only required if API descriptions have been changed. | |
| Open All | Open all nodes in the tree. Only enabled if the tree is grouped by products, categories or keywords. | |
| Close All | Close all nodes in the tree. Only enabled if the tree is grouped by products, categories or keywords. | |
| Reset | F5 | Reset all fields to their initial state. |
| Execute | F9 | Execute the example program related to the API. Works only if an API has been selected. |
On the right side of SYSEXT, the purpose, name, category and the
keywords of a selected API are displayed. Additionally, you can choose whether
you want to see the description of the API (member
USRnnnnT) or the source of the
corresponding example program
USRnnnnP.
To start an example program of a Natural API
Select an API in the SYSEXT tree. The fields on the right side are filled according to your selection.
Click on .
Or:
Double-click the API entry in the SYSEXT tree.
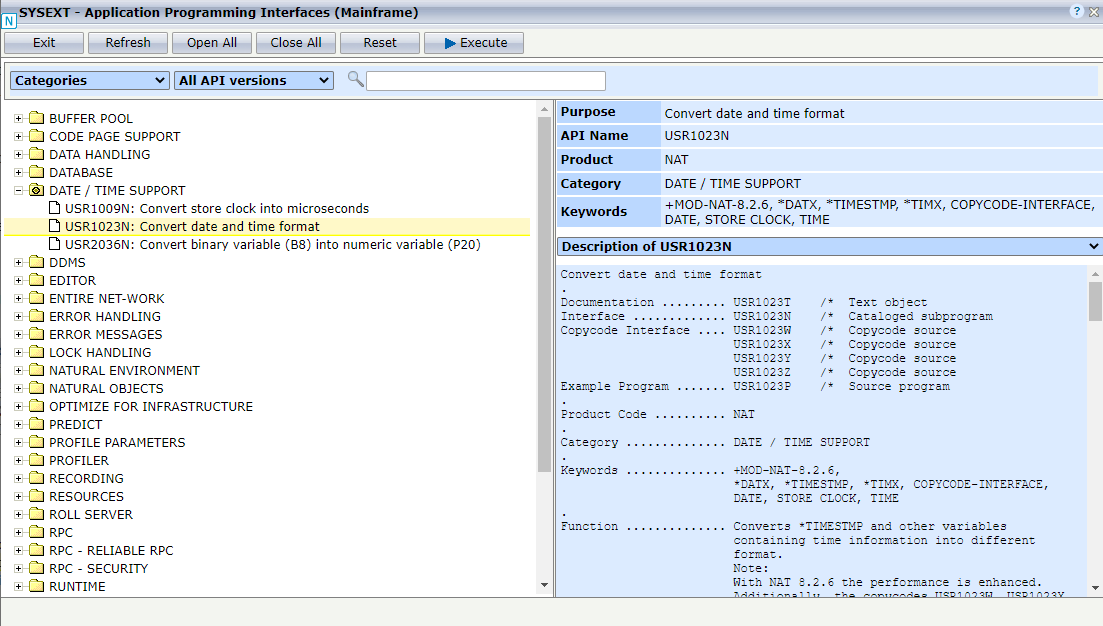
In the following example, the APIs of SYSEXT are grouped by
categories and the API USR1023N in the DATE/TIME
SUPPORT category has been selected. The entries on the right side
are filled with the values of the API USR1023N. The example
program USR1023P will be started by clicking on
.
The utility SYSEXV provides example programs that demonstrate the use of Natural features introduced in the current or a previous version of Natural.
This section describes the rich GUI interface to SYSEXV from NaturalONE. For further information regarding the SYSEXV utility, refer to the section SYSEXV Utility in the Natural documentation corresponding to your platform.
To start the SYSEXV utility
In your workspace, select any Natural project, library or object in the environment in which you want to start the SYSEXV utility.
Invoke the context menu and choose NaturalONE > Tools and Utilities to start the SYSUTIL utility.
Select SYSEXV in the tree and click on .
The rich GUI interface of the SYSEXV utility is displayed.
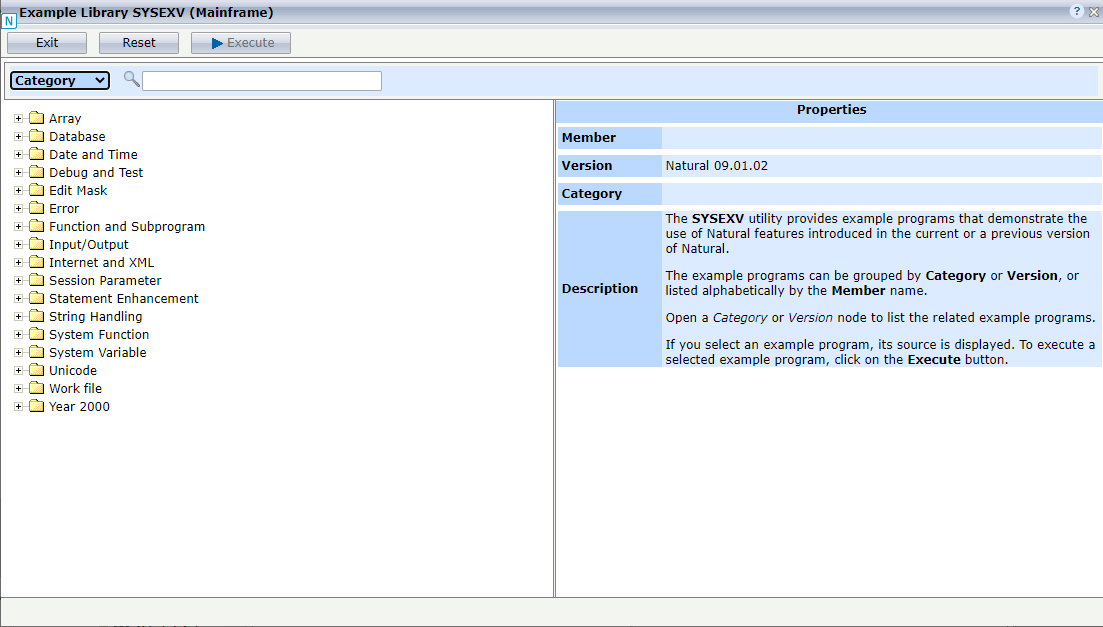
The example programs can be listed alphabetically by Member names or grouped by Category (default) or Version. You can specify a search string so that only the example programs containing the string in the member name, version, category or description are shown.
If you click on the help icon (![]() ) in the upper right corner of the page,
help information is provided.
) in the upper right corner of the page,
help information is provided.
The buttons in SYSEXV have the following meaning:
| Button | PF Key | Description |
|---|---|---|
| Exit | F3 | Exit SYSEXV. |
| Reset | F5 | Reset all fields to their initial state. |
| Execute | F9 | Execute the example program. Works only if an example program has been selected. |
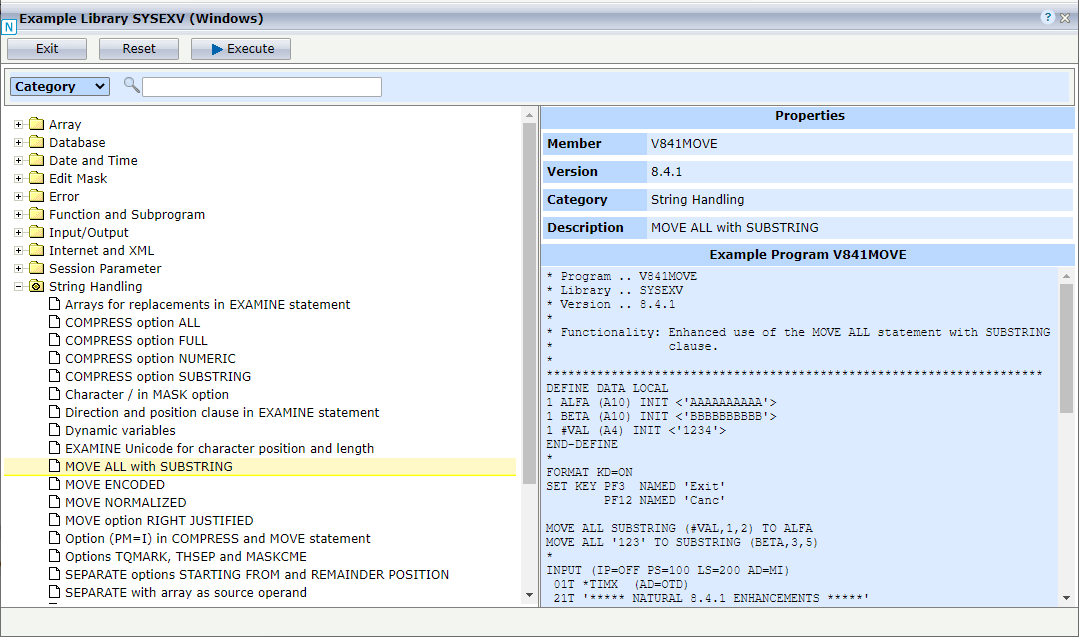
On the right side of SYSEXV, the member name of the example program, the version in which the Natural feature was introduced, the category and the description of the Natural feature are displayed. Additionally the source of the example program is provided.
To start an example program
Select an example program in the SYSEXV tree. The fields on the right side are filled according to your selection.
Click on .
Or:
Double-click the example program entry in the SYSEXV
tree.
In the following example, the example programs of SYSEXV are
grouped by categories and the example program for the MOVE ALL with
SUBSTRING feature in the String Handling
category has been selected. The entries on the right side are filled with the
values of the example program V841MOVE. The example program will
be started by clicking on .
This section describes the rich GUI interface of the Natural Profiler. For further information regarding the Natural Profiler utility, refer to the section Natural Profiler in the Natural documentation corresponding to your platform. This document covers the following topics:
The Natural Profiler (![]() ) monitors
the internal process flow of a Natural application
and analyzes the performance of the application. The
Natural code coverage measures the degree to which
the code of a program is executed.
) monitors
the internal process flow of a Natural application
and analyzes the performance of the application. The
Natural code coverage measures the degree to which
the code of a program is executed.
Profiler data is saved in Natural resource files. The following resource types are available:
![]() NPRF (Natural Profiler resource
file) - contains one record for each event. This is required for an event trace
evaluation.
NPRF (Natural Profiler resource
file) - contains one record for each event. This is required for an event trace
evaluation.
![]() NPRC (Natural Profiler
resource consolidated) - combines similar events into one consolidated record
containing aggregated time values and a hit counter.
NPRC (Natural Profiler
resource consolidated) - combines similar events into one consolidated record
containing aggregated time values and a hit counter.
![]() NCVF (Natural code coverage file) -
contains the data of a Natural code coverage run.
NCVF (Natural code coverage file) -
contains the data of a Natural code coverage run.
The Natural Profiler rich GUI reads and analyzes Profiler resource files.
To start the Natural Profiler rich GUI
In your workspace, select any Natural project, library, or object in the environment in which you want to start the Profiler rich GUI.
Invoke the context menu and choose NaturalONE > Tools and Utilities to start the SYSUTIL utility.
Select Natural Profiler in the tree and click on Execute.
The Natural Profiler page is displayed.
The page lists all Profiler resources of a given library. For a selected Profiler resource, the properties and statistics of the profiling are displayed. Functions are available to evaluate or consolidate Profiler data, or to delete a resource file. The available functions are provided as buttons and as context menu entries.
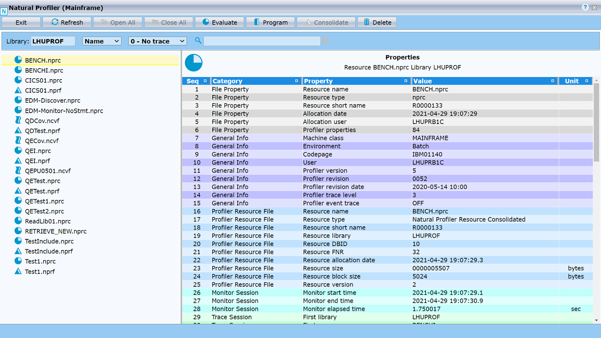
On the left side of the Natural Profiler page, the profiler resources of the current selected library are displayed. The profiler resources can be listed alphabetically by resource Name (default) or grouped by resource Type, resource allocation Date, or User (ID of the user who allocated the resource).
You can specify a search string (![]() ) so that only the
resources containing the string in the resource name, resource type, resource
short name, allocation date or time, or user ID are shown.
) so that only the
resources containing the string in the resource name, resource type, resource
short name, allocation date or time, or user ID are shown.
If you click on the help icon (![]() ) in the upper right corner
of the page, help information is provided.
) in the upper right corner
of the page, help information is provided.
The following buttons are available:
| Button | PF Key | Description |
|---|---|---|
| Exit | F3 | Exit the Natural Profiler. |
| F5 | Refresh the resource list and reset all fields to initial state. | |
| Open all nodes in the tree. Only enabled if the tree is grouped. | ||
| Close all nodes in the tree. Only enabled if the tree is grouped. | ||
| Start the Profiler Data Evaluation. It uses pie charts to show the distribution of Profiler KPIs for selected criterions like the distribution of the CPU time for programs. Summarized totals of the KPI values are also displayed. Additional options are available to list or save the selected data. The Profiler Data Evaluation is only available for NPRC resources. | ||
| Start the Profiler Program Analysis. It lists all monitored programs and the source code of a selected program. For a selected KPI (like CPU time), the distribution of the KPI over the programs and over the program lines is displayed. Additional options are available to save the selected data. The Profiler Program Analysis is only available for NPRC resources. | ||
| Consolidate the Profiler data. The selected NPRF resource is read, and the data is consolidated (aggregated). The resulting data is written to an NPRC resource using the same name as the corresponding NPRF resource. The Profiler data consolidation is only available for NPRF resources. | ||
| Delete the selected resource file. On the mainframe it deletes the resource in chunks (with an end of transaction after each chunk) to avoid a NAT3047 error for big resources. If the DELETE function fails by any reason, you need to repeat it to get rid of inconsistent data. |
The following entries are provided in the page header:
| Entry | Description |
|---|---|
| Library | The Natural library containing the Natural Profiler resources. |
| Grouping selection | Select whether the resources should be listed by name, or grouped by type, date, or user. |
| Trace Level selection | Select the level of the Profiler internal trace. The higher the trace level, the more verbose the trace is. The trace is written to the screen. |
| List only resources which satisfy the search criteria. |
On the right side of the Natural Profiler page, profiler properties and statistics are displayed. The entries are grouped by categories whereby each category is indicated by another color.
If no resource is selected, general Profiler statistics of the current selected library are listed.
If a resource is selected, the properties and statistics of the corresponding Profiler run are displayed.
The (grey) File Property category values are provided by Natural for the selected resource.
The other (colored) categories have been collected by the Profiler while the application was monitored.
If you move the mouse over a property, a more detailed description of the property is provided as a tool tip.
Note:
The Natural Profiler on UNIX and Windows does not collect
properties and statistics. Therefore, only file properties can be displayed for
the corresponding resources. If you consolidate an NPRF
file on UNIX or Windows, the resulting NPRC file contains
those statistics which can be determined from the collected trace data.
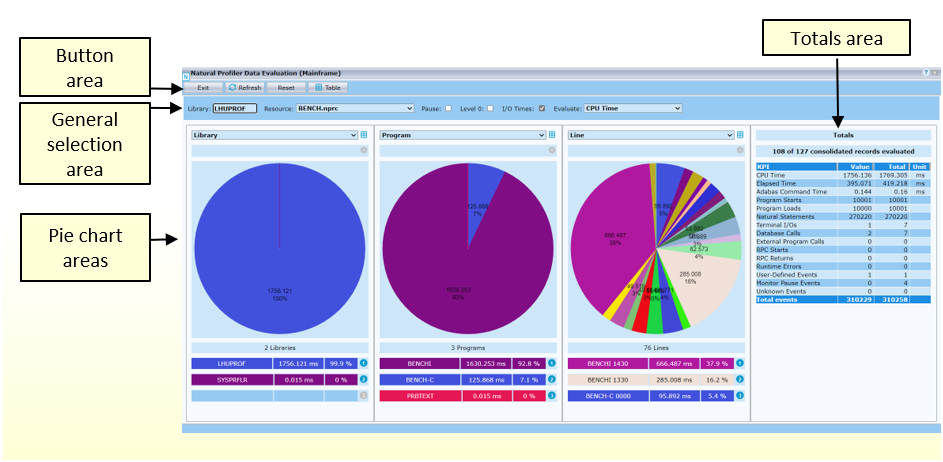
For a given Profiler resource file, the Profiler Data
Evaluation uses pie charts to show the distribution of Profiler KPIs
for selected criteria, like the distribution of the CPU time for programs.
Summarized totals of the KPI values are also displayed. Additional options are
available to list or save the selected data. If you click on the help icon
(![]() ) in the upper right corner
of the page, help information is provided.
) in the upper right corner
of the page, help information is provided.
The Profiler Data Evaluation is only available for NPRC resources.
The following buttons are available:
| Button | PF Key | Description |
|---|---|---|
| Exit | F3 | Exit the Natural Profiler Data Evaluation. |
| F5 | Refresh the resource list. | |
| Reset | Reset all fields to initial state. | |
| List or export the consolidated event data according to the current selections. See Event Data Table. |
The following entries are provided in the page header:
| Entry | Description |
|---|---|
| Library | Specify the Natural library containing the Natural Profiler resources. |
| Resource selection | Select the Profiler resource for the evaluation. Only NPRC resources are listed. |
| Pause checkbox | Check to evaluate Monitor Pause events. Then you can examine how often, how long and why monitoring paused. By default, the evaluation does not reflect Monitor Pause events. |
| Level 0 checkbox | Check to evaluate events which are executed at program level 0. These events usually relate to the Natural administration rather than to the application execution. By default, the evaluation does not reflect the events at program level 0. |
| I/O Times checkbox | Check to evaluate I/O and Natural RPC client times. For an interactive application, these times mainly measure the user reaction (how long it took to press ENTER). They are less relevant for the application performance. By default, the evaluation reflects the I/O and client times. |
| Evaluate selection | Select the key performance indicator (KPI) for the evaluation. The combo box lists only those KPI which are available in the current data. The complete list of KPIs is displayed below. |
The following KPIs are available:
CPU Time in milliseconds (ms)
Elapsed Time in milliseconds (ms)
Adabas Command Time in milliseconds (ms)
Number of Program Starts (PS events)
Number of Program Loads (PL events)
Number of Natural Statements (NS events)
Number of Terminal I/Os (IA events)
Number of Database Calls (DA events)
Number of External Program Calls (CA events)
Number of RPC Starts (RS events)
Number of RPC Returns (RO events)
Number of Runtime Errors (E events)
Number of User-Defined Events (U events)
Number of Monitor Pause Events (MP events)
Number of Unknown Events
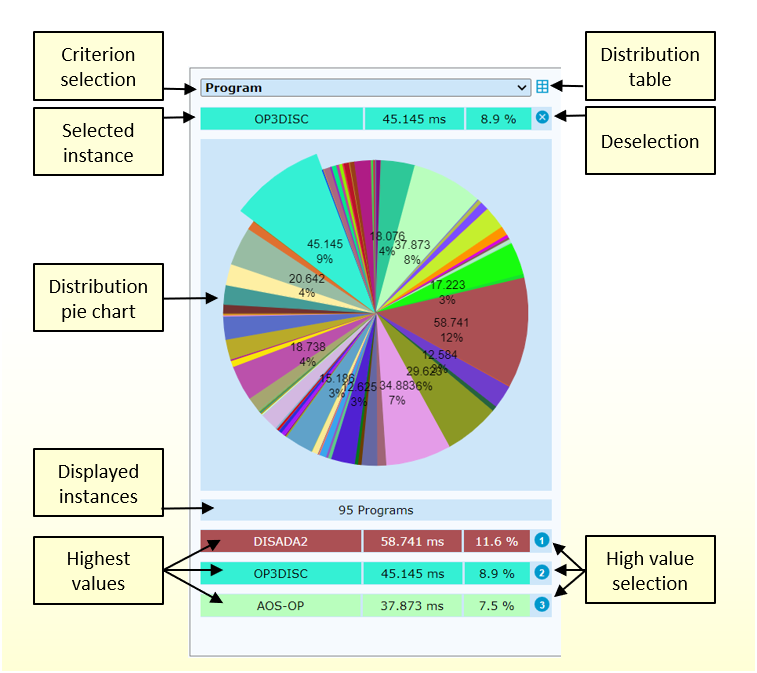
Each of the three pie chart areas contains the following elements (from top to bottom and left to right):
Criterion selection, see Criteria.
Table icon (![]() ) to list, export or select data of the pie
chart, see Distribution
Table
) to list, export or select data of the pie
chart, see Distribution
Table
Current selected instance with accumulated KPI value and percentage
Deselection icon (
![]() ) to deselect the
current pie chart selection
) to deselect the
current pie chart selection
The distribution pie chart which shows the distribution of the KPI (selected in the Evaluate selection box) for the criterion selected in the box above the pie chart
A line showing the number of displayed instances
Three lines with the three highest values
Numbered icon (like
![]() ) to select the
corresponding segment in the pie chart
) to select the
corresponding segment in the pie chart
To select an instance in a pie chart, you can
click on the corresponding segment in the pie chart.
Or:
click on the numbered icon if you want to select one of
the three highest values.
Or:
click on the table icon and select a line in the table.
The selection in the table is especially useful if the value is relatively
small and hard to pick out in the pie chart.
If a segment in the pie chart is selected, all following pie
charts, the totals and the Event Data
Table use the selected value as filter criterion. If you
select, for example, in the second pie chart the program PROGA,
the third pie chart will only show line numbers of program PROGA.
The Event Data Table and the Value column of the Totals table will reflect only
data of program PROGA.
To remove a selection
click on the background of the pie chart.
Or:
click on the deselect icon above the pie chart.
The pie charts show the distribution of Profiler KPIs for selected criteria. If for example, CPU time is selected as KPI and Programs as criteria, the pie chart shows the distribution of the CPU time for the executed programs.
The following table lists the available criteria. Some criteria are only available for specific event types. If you select an event-specific criterion, the pie chart will only reflect the data of the related events.
| Criterion | Event | Description |
|---|---|---|
| Client User | RI, RO, RW | Natural RPC client user ID |
| Command | DB, DA | Adabas command issued |
| Consumer | all | The consumer combines one or more
event types into a new criterion. The new criterion depends on the process that
consumed the CPU or elapsed time given with the event data. The following
consumers are provided:
|
| Event | all | Type of the event executed (for example, PS for program start events) |
| File | PS, PT | Database ID and file number of the Natural system file |
| DB, DA | Database ID and file number of the Adabas file accessed | |
| Group | all | Group ID for Natural applications running under Natural Security |
| Level | all | Level at which the profiled program executes |
| Library | all | Natural library that contains the profiled program |
| Line | all | Line number of the profiled Natural statement. For unique identification, the line number can be preceded by the program name and if applicable, the copycode name. |
| Line100 | all | Source lines with similar line numbers (rounded down to the next multiple of 100) |
| Program | all | Name of the profiled program |
| Return Code | ST | Termination return code |
| DA | Database response and subcode | |
| CA | Subprogram response code | |
| E | Error number | |
| RI, RO, RW | Natural RPC return code | |
| Statement | all | Natural statement (for example, EXAMINE) executed in the profiled program |
| Target Program | ST | Session backend program name |
| PL | Target program name | |
| CB, CA | Name of the called subprogram | |
| E | Error handling program name | |
| RS | Natural RPC subprogram name | |
| Type | PS, PT | Program type |
| MP | Monitor pause reason | |
| U | User event subtype | |
| ST | Return code indicator (system or user) | |
| User | all | Natural user ID |
The Totals area lists for all KPIs the total summarized values (column "Total") and the summarized values according to the current selection (column "Value"). Additionally, it shows how many consolidated records and how many events are currently evaluated. Note that the KPIs listed in the table, do not reflect all available event types. Therefore, the total number of events listed in the last line of the table, can be higher than the sum of the KPI counts which are listed in the body of the table.
If you click on a table icon (
![]() ) above a pie chart, the
Distribution Table is displayed in a popup. It lists all
instances, values and percentages from the pie chart. The lines are colored
according to their value, from a light blue for low values to red for high
values. If you click on a header cell, the table will be sorted by the
corresponding column. Options are available to copy all or selected lines to
the clipboard and to export the data. If you select a line before you close the
popup, the corresponding segment will be selected in the pie chart.
) above a pie chart, the
Distribution Table is displayed in a popup. It lists all
instances, values and percentages from the pie chart. The lines are colored
according to their value, from a light blue for low values to red for high
values. If you click on a header cell, the table will be sorted by the
corresponding column. Options are available to copy all or selected lines to
the clipboard and to export the data. If you select a line before you close the
popup, the corresponding segment will be selected in the pie chart.
If you click on the table button in the page header, the Event Data Table is displayed in a popup. It lists the consolidated events which are currently selected. Each line shows the Criteria belonging to the event, the accumulated CPU, elapsed and Adabas time and the corresponding hit count. The KPI values are colored according to their value, from a light blue for low values to red for high values. If you click on a header cell, the table will be sorted by the corresponding column. Options are available to copy all or selected lines to the clipboard and to export the data.
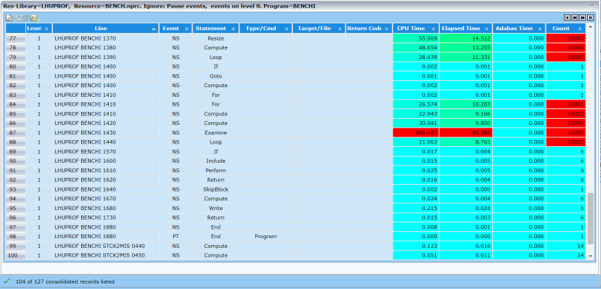
Note:
For technical reasons, there is no one-to-one relationship
between a Natural source code statement and the
corresponding object code in the cataloged object. Because the object code is
used for the consolidation, it can happen that multiple lines in the
Event Data Table show the same criteria with the same
Natural statement.
For a given Profiler resource file, the Natural Profiler Program
Analysis lists all monitored programs and the source code of a selected
program. For a selected KPI (like CPU time), the distribution of the KPI over
the programs and program lines is displayed. Additional options are available
to save or copy the selected data. If you click on the help icon
(![]() ) in the upper right corner
of the page, help information is provided.
) in the upper right corner
of the page, help information is provided.
The Profiler program analysis is only available for NPRC resources.
The following buttons are available:
| Button | PF Key | Description |
|---|---|---|
| Exit | F3 | Exit the Natural Profiler Program Analysis. |
| F5 | Refresh the resource list and re-read the resource data. | |
| Reset | Reset all fields to initial state. | |
| Save the data of the source code area as CSV file or copy it to the clipboard as described later. |
The following entries are provided in the page header:
| Entry | Description |
|---|---|
| Library | Specify the Natural library containing the Natural Profiler resources. |
| Resource selection | Select the Profiler resource for the evaluation. Only NPRC resources are listed. |
| Pause checkbox | Check to evaluate Monitor Pause events. By default, the evaluation does not reflect Monitor Pause events. |
| Level 0 checkbox | Check to evaluate events which are executed at program level 0. These events usually relate to the Natural administration rather than to the application execution. By default, the evaluation does not reflect the events at program level 0. |
| I/O Times checkbox | Check to evaluate I/O and Natural RPC client times. For an interactive application, these times mainly measure the user reaction (how long it took to press ENTER). They are less relevant for the application performance. By default, the evaluation reflects the I/O and client times. |
| Evaluate selection | Select the key performance indicator (KPI) for the evaluation. The combo box lists only those KPI which are available in the current data. The complete list of KPIs is displayed below. |
| Show selection | Select whether the Natural source code or the object code of the executed statements is listed. By default, the source code is displayed. If the source of an object is not found, only the object code of the executed statements can be displayed. |
The following KPIs are available:
CPU Time in milliseconds (ms)
Elapsed Time in milliseconds (ms)
Adabas Command Time in milliseconds (ms)
Number of Program Starts (PS events)
Number of Program Loads (PL events)
Number of Natural Statements (NS events)
Number of Terminal I/Os (IA events)
Number of Database Calls (DA events)
Number of External Program Calls (CA events)
Number of RPC Starts (RS events)
Number of RPC Returns (RO events)
Number of Runtime Errors (E events)
Number of User-Defined Events (U events)
Number of Monitor Pause Events (MP events)
Number of Unknown Events
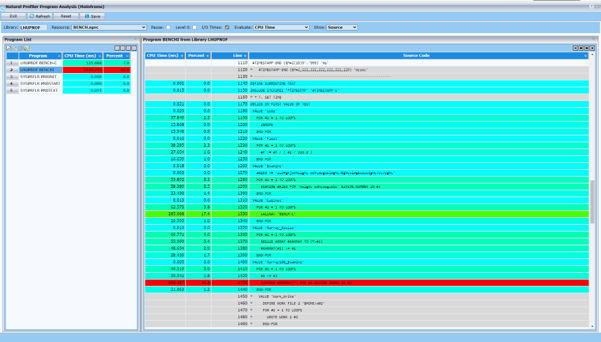
On the left side of the Natural Profiler Program Analysis page, all programs (Natural objects) which have been monitored at the Profiler run, are listed. For each program, the accumulated KPI value (selected in the Evaluate selection box) and percentage is displayed. The lines are colored according to their value, from a light blue for low values to red for high values. If you click on a header cell, the table will be sorted by the corresponding column. If you select a line, the corresponding program source code will be shown in the source code area. Options are available to copy all lines to the clipboard and to export the data to a CSV file.
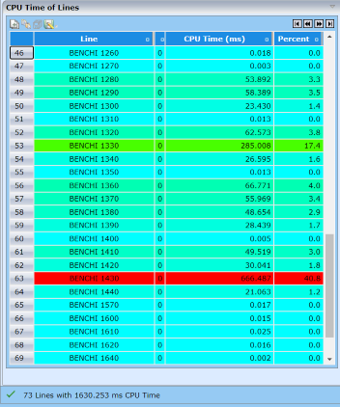
On the right side of the Natural Profiler Program Analysis page, the source code of the program (Natural object) selected in the program list, is displayed. For each line, the accumulated KPI value (selected in the Evaluate selection box) and percentage is shown. The lines are colored according to their value, from a light blue for low values to red for high values. Comment lines and empty lines are grey. All other lines are white colored. These are in general lines which have not been monitored or continuation lines of statements.
If the program includes copycodes, they are listed behind the program source. For copycodes, the Line column shows the name of the copycode together with the line number. If the same copycode is included more than once in the program, the corresponding line entries are combined into one entry.
If you click on a header cell, the table will be sorted by the corresponding column.
If the source of the program is not found or if Executed has been selected in the Show selection box, the object codes of the executed statements are listed. For technical reasons, there is no one-to-one relationship between a Natural source code statement and the corresponding object code in the cataloged object. Therefore, multiple source code statements can be merged into one object code and conversely, one source code statement can cover multiple object codes. For example, the statements ADD, SUBTRACT, and other mathematical operations are all covered by the Compute object code.
If you click on the
![]() Save button in the page header, the data of the source
code area is prepared for the copy/save and displayed in a popup. You may copy
all or selected lines to the clipboard or export the data to a CSV file. Note
that time values are converted from milliseconds to microseconds so that no
decimal point is needed anymore.
Save button in the page header, the data of the source
code area is prepared for the copy/save and displayed in a popup. You may copy
all or selected lines to the clipboard or export the data to a CSV file. Note
that time values are converted from milliseconds to microseconds so that no
decimal point is needed anymore.
Notes:
The SYSUTIL Message Retrieval function is used to read Natural or user defined messages.
To start the Message Retrieval
In your workspace, select any Natural project, library or object for which you want to start the message retrieval. If you have selected a library or an object in a library, this library is taken as default library for user defined messages.
Invoke the context menu and choose NaturalONE > Tools and Utilities to start the SYSUTIL utility.
Select Message Retrieval in the tree.
Add parameters to the command as desired.
Click on .
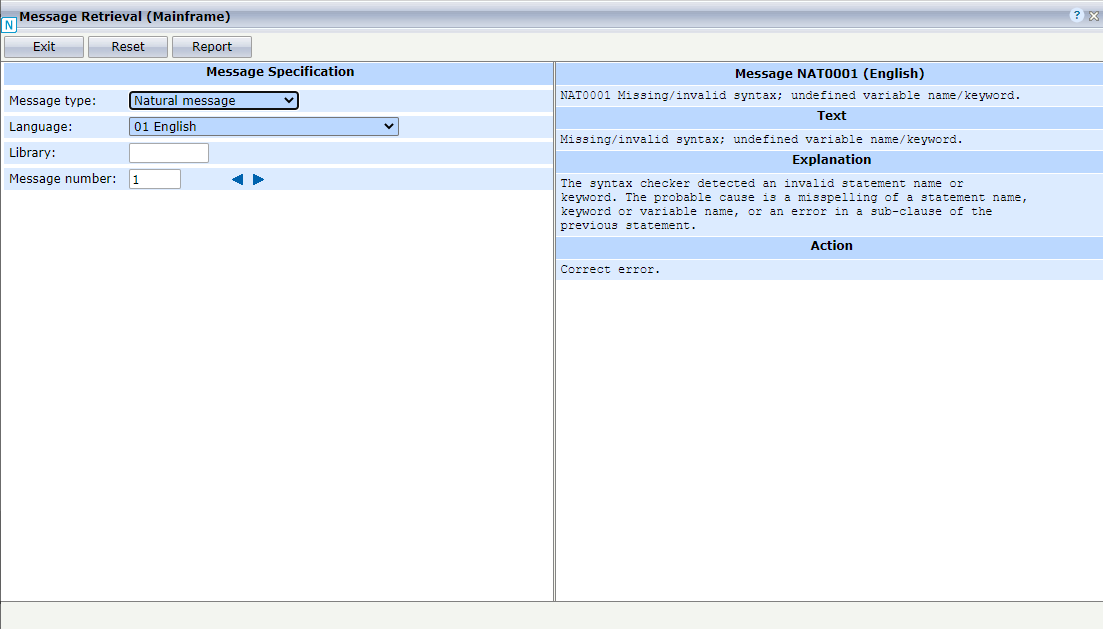
The Message Retrieval is displayed.
The SYSUTIL Message Retrieval function offers the following parameters:
SYSUTIL -MSG [nnnn [library]]
Where nnnn is the message number and library is the library containing the user defined message.
Alternatively, you can start the SYSUTIL Message Retrieval with the following command:
? [nnnn [library]]
If the message number and the library are specified, the user
defined message nnnn from library
library is displayed. If only the message number is
specified, the Natural message nnnn is displayed. If
no parameter is given, the Natural message NAT0001 is shown
initially.
If you click on the help icon (
![]() ) in the upper right corner of
the page, help information is provided.
) in the upper right corner of
the page, help information is provided.
The buttons in Message Retrieval have the following meaning:
| Button | PF Key | Description |
|---|---|---|
| Exit | F3 | Exit Message Retrieval. |
| Reset | F5 | Reset all fields to their initial state. |
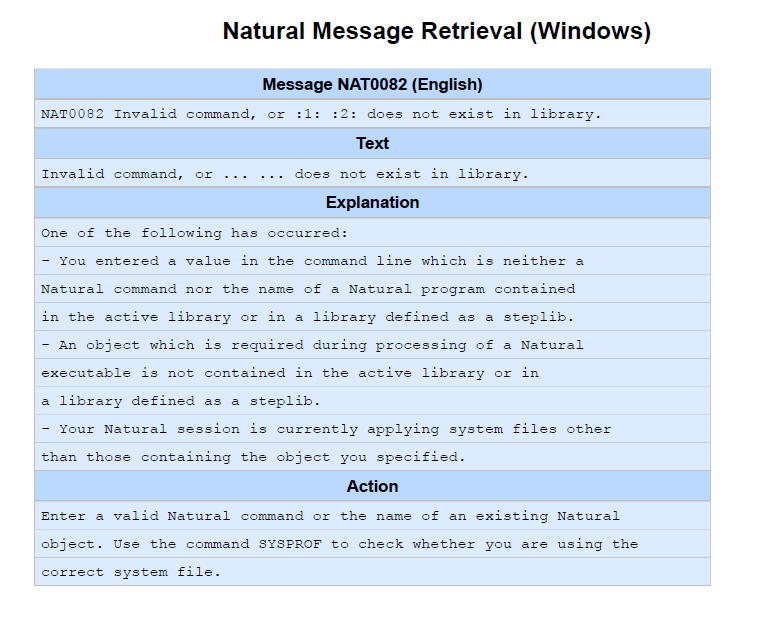
| Report | F9 | A preview of the message is generated. It can be used for printing the message or converting it into a PDF member. |
The entries on the left side of the Message Retrieval have the following meaning:
| Entry | Description |
|---|---|
| Message type | Select the message type: Natural message or User defined message. If you view Natural messages, the Library field is cleared. If you view user defined messages, the Library field is filled with the previously used user library or initially, with the library from which you have started the Natural tools and utilities. |
| Language | Choose the language of the message. |
| Library | If you clear this field, Natural messages are displayed. Enter a library name to view the user messages of the given library. |
| Message number | The number of the message to be displayed. Click on the left or right arrow to show the previous or next message. |
On the right side of the Message Retrieval, the short and long text of the message is displayed.
The following example shows the PDF output of the Natural message 82.
The SYSUTIL utility can be extended to also list user defined tools in the tree.
To extend the Natural tools and utilities
Create an XML member according to the SYSUTIL standards.
Name it either TOOL-*.XML or
USER-uid.XML where the asterisk
(*) stands for any character combination and
uid for a user ID.
Save the XML member in the Resource folder of the SYSUTIL library.
TOOL-*.XML contains customer specific tools. It is
visible to all who share the same FNAT system file.
USER-uid.XML contains user
specific tools. It is only visible to the user with the *INIT-USER
user ID uid.
Notes:
SAG-*.XML contains Software AG tools. Do not
modify these members.
EXAMPLE.XML in the library SYSUTIL
contains an example XML. You may use it as template for creating your own XML
members.
The following shows the standard layout of a SYSUTIL XML member:
<?xml version='1.0' ?>
<SYSUTIL VERSION='version' USAGE='usage'>
  <COMMENT>comment</COMMENT>
  <TOOL>
    <NAME>name</NAME>
    <TITLE>title</TITLE>
    <LIBRARY>library</LIBRARY>
    <COMMAND>command</COMMAND>
    <CLEARSCREEN>clear-screen</CLEARSCREEN>
    <CATEGORY>category</CATEGORY>
    <KEYWORDS>keywords</KEYWORDS>
    <DESCRIPTION>description</DESCRIPTION>
    <MACHINE-CLASS>machine-class:filter</MACHINE-CLASS>
  </TOOL>
  <TOOL>
    ...
  </TOOL>
</SYSUTIL>
The entries in the XML member have the following meaning:
| Tag Value | Description | ||||||||
|---|---|---|---|---|---|---|---|---|---|
version |
The version of the XML member. The entry is not interpreted by SYSUTIL. | ||||||||
usage
|
A short internal description of the XML member. The entry is not interpreted by SYSUTIL. | ||||||||
comment |
More detailed internal description of the XML member. The tag is not interpreted by SYSUTIL. | ||||||||
name |
The name of the tool. It is used as main index in the list of tools. Maximum size: 32 characters. | ||||||||
title |
A descriptive title of the tool. It is used as supplement to the tool name in the list of tools. Maximum size: 61 characters. | ||||||||
library |
SYSUTIL issues a Default: If started on a project level: SYSTEM Otherwise: Current library |
||||||||
command |
The command, program or URL to be executed. Parameters may be added separated by blanks. The following special values can be used in the command:
|
||||||||
clear-screen |
Whether SYSUTIL clears the screen before command
execution. This may be set to Possible values: Default: |
||||||||
category |
The category to which the tool belongs. If appropriate, use an existing category of SYSUTIL. | ||||||||
keywords |
Keywords associated to the tool. The keywords are written in upper case and separated by commas. If appropriate, use existing keywords of SYSUTIL. | ||||||||
description |
The long description of the tool in HTML format. To avoid that special characters of HTML are interpreted by XML, replace the following characters:
Alternatively, you can save the description in HTML format (without replacements) in a UTF-8 resource in the SYSUTIL library. Start the DESCRIPTION value with "HTML:" followed by the name of the HTML resource. For example: HTML:MyDesc.htm |
||||||||
machine-class:filter |
|
The following example shows the example XML member
TOOL-Admin.XML for SYSUTIL. If you save it in the SYSUTIL resource
folder, the ReadCust application will be added to the list of
tools. The one-letter filter code (here: S) in the
MACHINE-CLASS tag has the effect that the ReadCust application is
only shown in the list of tools if the user is allowed by Natural Security to
execute the application.
<?xml version='1.0' ?>
<SYSUTIL VERSION='1.0' USAGE='SYSUTIL entry for READCUST'>
<COMMENT>
Customer data administration
</COMMENT>
<TOOL>
<NAME>ReadCust</NAME>
<TITLE>Read customer data</TITLE>
<LIBRARY>CUSTLIB</LIBRARY>
<COMMAND>READCUST</COMMAND>
<CLEARSCREEN>FALSE</CLEARSCREEN>
<CATEGORY>Administration</CATEGORY>
<KEYWORDS>DATABASE,READ,CUSTOMER</KEYWORDS>
<DESCRIPTION>Read all <strong>customer</strong> data.</DESCRIPTION>
<MACHINE-CLASS>A:S</MACHINE-CLASS>
</TOOL>
</SYSUTIL>
If Natural Tools and Utilities has been extended to call a user defined tool, it is a desired behavior that after the user tool has finished, control is given back to SYSUTIL. Therefore, SYSUTIL places itself on the Natural stack including all settings so that it is restarted automatically when the user defined tool ends. All selections and field contents of SYSUTIL are restored to the state it was in before the user defined tool had been called.
If the user defined tool releases the Natural stack with a
RELEASE STACK command by any reason, the approach
described above will not work. In this case, the tool may issue the statement
STACK TOP COMMAND 'RETURN'. This will restart
SYSUTIL, but all selections and field contents will be set to initial state.
The information regarding the library and object selection will also be lost.