
This document covers the following topics:
The Natural Profiler is used to monitor the internal process flow of a Natural application and to collect trace data for selected events that are performed within a Natural application. It helps application programmers, administrators and quality engineers to analyze the logical flow of Natural applications and to trace the utilization of resources. A Natural Profiler analysis can be used for performance optimization of Natural applications as described in Performance Analysis of Natural Applications in the NaturalONE in a Nutshell documentation.
If you want to use the Natural Profiler in a UNIX or Windows environment, Web I/O must have been enabled on the Natural server. Otherwise, a profiler session cannot be started.
The use of the Natural Profiler can be controlled by Natural Security. If Natural Security is being used, a Natural Profiler utility profile must have been defined, within which the Start/Stop Profiler Tracing option must be set. For more information, see the Natural Security documentation, which is part of the Natural documentation.
If you want to use the Natural Profiler in a UNIX or Windows environment, Natural Version 8.3.6 or above is required on the server.
If you intend to collect data for the used Natural statements and
you are using a Natural server in a UNIX or Windows environment, the programs to be traced must have
been cataloged with GPGEN=(PROFILER=ON). With
GPGEN=(PROFILER=ON), statement events will be generated when the
program is executed. If an object was catalogued with
GPGEN=(PROFILER=OFF), the program's icon is overlaid with a
warning decorator on the Hot
Spots page, and an explanatory tooltip is shown for the
program node when hovering over it with the mouse.
If you want to use the Natural Profiler in a mainframe environment, a batch Natural Development Server is required. If you try to profile a program and your Natural Development Server uses the Natural CICS adapter, you will receive the following message:
Response Code: 102 (Initialization of the Profiler Data Pool failed (NATRDC1/I RC=-1))
Event data from a Natural batch profiling session on the mainframe is stored in a Natural resource file. By default, mainframe resource files are not shown in NaturalONE. If you want to view the event data in NaturalONE (see also Displaying Natural Profiler Resource Data), you have to enable the display of the resource files in your Natural Development Server environment. For more information, see the prerequisites for the Profiler utility in batch mode in the Utilities documentation, which is part of the Natural documentation for mainframes.
To use the Natural Profiler with a Natural program, you must first compile the program in your Natural environment in order to create a generated program in this environment. See also Updating the Objects in the Natural Environment.
The library in which a profiler session for the generated program is started is determined by the mode you have defined for the project (either shared mode or private mode). See Steplibs in Changing the Project Properties for further information.
Important:
The contents of the source in the workspace must be
identical with the contents of the corresponding object on the server.
The following topics are covered below:
When you start a profiler session for an application on a Natural server as described below, trace data for the defined event types is collected on the server during the profiler session. The event types are defined in the Natural preferences. For more information, see Profiler in Setting the Preferences.
For details concerning the Default Launch settings, see Launching Natural Applications.
 To start a profiler session and display the output
In the Navigator view or in the Natural Navigator view, select the program for which you want to start a profiler session.
Invoke the context menu and choose .
The profiler session is started and the following occurs:
The profiler output is shown in the editor area. For more information, see Viewing the Profiler Output.
An entry for the program for which you have started the profiler session is shown in the Profiler Sessions view. For more information on this view, see Managing the Profiler Sessions.
The profiler output is automatically shown in the editor area when you start a profiler session or open a Natural Profiler resource file. It is shown on the following profiler pages:
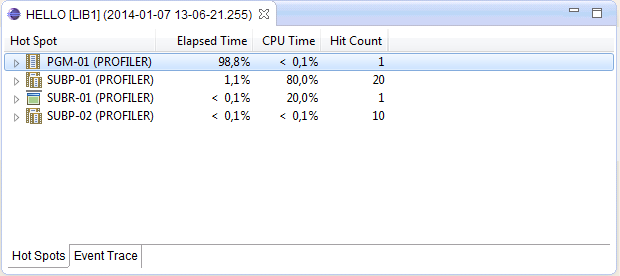
This page shows how the time was primarily spent during the execution of the application. It can be used to identify the parts of the application that can be most expediently optimized.
The hot spots are the involved Natural objects. The elapsed time and the CPU time for each Natural object are shown in percent. The hit count for each Natural object is also shown; this informs you how often the object has been invoked (for example, in a loop).
If your code contains an I/O statement (for example, an
INPUT or WRITE statement), the elapsed time also
includes the time that the system has waited for you to react on the
output.
When the option Profile statements is enabled in the Natural preferences (see Profiler > Hot Spots in Setting the Preferences), expandable nodes are shown. When you expand a node, the values for the Natural objects are no longer shown. Instead, elapsed time, CPU time and hit count are shown for each item in the expanded node. This can be either the name of a statement or, when you expand the node further, a line number in the source. For example:
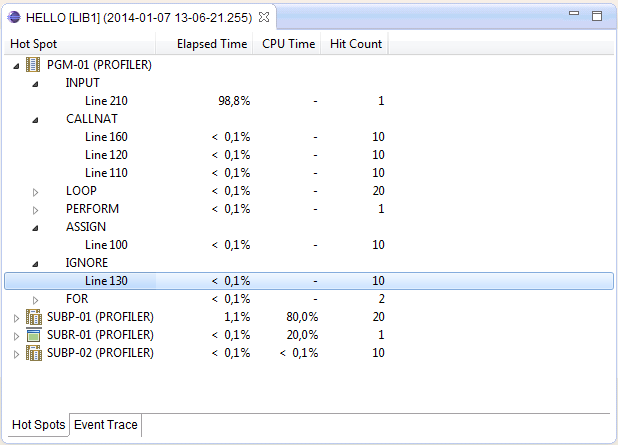
You double-click a node to expand it. When a node is fully expanded (that is, when a line number is shown), you can navigate directly to the corresponding source code line. To do so, you double-click the entry which indicates the line number, or you select that entry and then choose Edit from the context menu.
If you want to reduce the number of events sent by the trace session, you can enable sampling in the Natural preferences. Or you can specify display limits in the Natural preferences. See Profiler > Hot Spots in Setting the Preferences for further information.
This page is only shown if the event trace has been enabled in the Natural preferences. The event types to be collected are also defined in the Natural preferences. For further information, see Profiler > Event Trace in Setting the Preferences.
When the event trace has been enabled, this page shows the trace records for the events which have been collected on the server. These records provide the raw data on which the information on the Hot Spots page is based. For example, the Before Database Call (DB) and After Database Call (DA) trace records define the extent of a specific database event.
Note:
For information on the abbreviations which are shown in the
Type column of the Event Trace page
(such as DB or DA), see Overview of Event
Types.
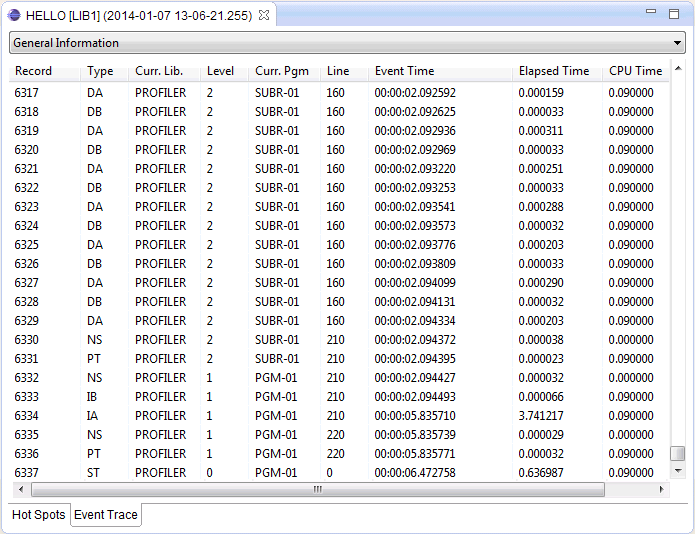
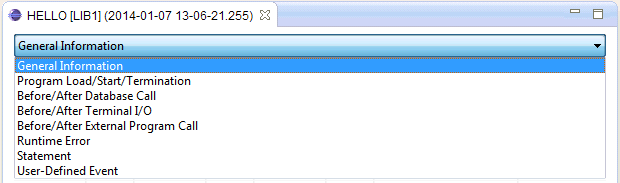
The drop-down list box which is shown at the top of the Event Trace page determines the columns that are shown on this page. It lists the so-called "views" from the mainframe. The "General Information" view is shown by default. The columns of this view show general data which are common to all records. The other views show columns for event-specific data.
You can reorder the columns on the Event Trace page by dragging a column header to a different position.
When you select an event on the Event Trace page, the contents of the corresponding trace record are automatically shown in the Properties view. Other than on the Event Trace page where only selected columns are shown, the Properties view shows all trace data for a record.
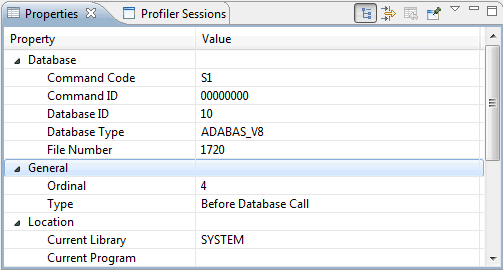
The information that is shown in the Properties view depends on the type of the event that is currently selected on the Event Trace page. For example, database ID and file number are shown for a database event, but not for a terminal I/O event.
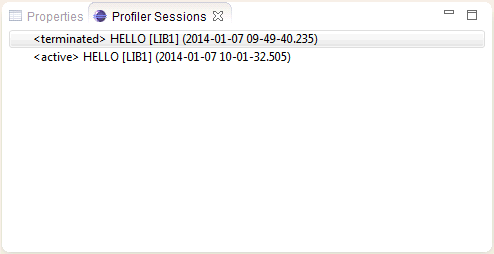
The Profiler Sessions view appears automatically when you start a profiler session for the first time. It shows an entry for each program for which you have started a profiler session. The list of profiler sessions in this view is not persistent. It shows only the profiler sessions which have been started during the current Eclipse session. If you want to keep the profiling results of a profiler session for a later Eclipse session, you can save them.
When you exit Eclipse, NaturalONE terminates all of your active profiler sessions on the server.
Note:
The Profiler Sessions view is a
Natural-specific view. If it is currently not shown, you can display it with
Window > Show View > Other > Software AG NaturalONE >
Profiler Sessions.
The following topics are covered below:
The profiler sessions that are shown in the Profiler Sessions view can be in different states. The current state is always indicated next to the session name. Possible states are:
Active
The sessions for which you have started profiling and which
are still running are in the state "active".
Stopped
The sessions for which you have stopped profiling are in the
state "stopped". See also
Stopping a Profiler
Session.
Terminated
The sessions which have been terminated on the server are in
the state "terminated".
When you start a profiler session, the profiler output is automatically shown in the editor area. If you close the output for a particular profiler session, you can reopen the session as described below.
Note:
Keep in mind that the Profiler Sessions
view only shows the profiler sessions of the current Eclipse session. If you
want to open a saved profiler session from a previous Eclipse session, you have
to do this from the Navigator view or Natural
Navigator view. See also
Saving the
Results of a Profiler Session.
To open a profiler session
In the Profiler Sessions view, select the profiler session that you want to open.
Invoke the context menu and choose .
Or:
Double-click the profiler session that you want to
open.
All profiler sessions that you start only exist as long as your Eclipse session is running. If you want to keep the results of a profiler session for a later Eclipse session, you have to save the session. This is helpful, if you want to compare the trace results of different profiler sessions in order to find out, for example, whether the performance of your application has improved.
A saved profiler session will be shown as an XML file in the Navigator view and in the Natural Navigator view. You can then open the output for this session in the editor area by double-clicking it or by using the command.
To save a profiler session
In the Profiler Sessions view, invoke the context menu for the session that you want to save and choose .
In the resulting dialog box, select the project in which the profiler session is to be stored and specify a name for the session. For example:
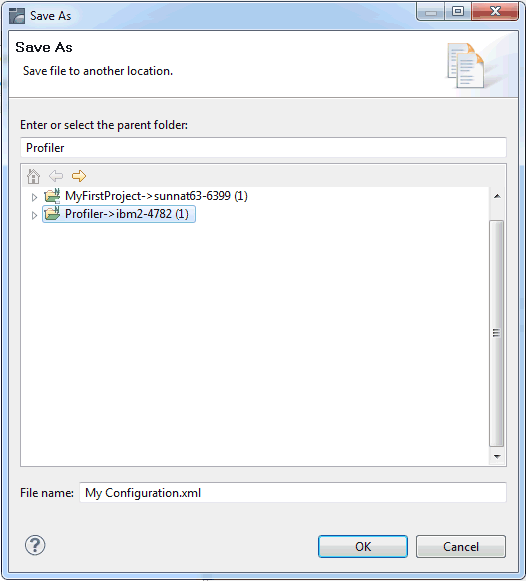
Choose the button.
When a profiler session is currently active, you can stop profiling. In this case, the profiler output in the editor area will show incomplete data. Stopped profiler sessions cannot be restarted.
Note:
Even though a session has been stopped, it continues running
on the server until it terminates there.
To stop a profiler session
In the Profiler Sessions view, select the session that you want to stop.
Invoke the context menu and choose .
The new state "stopped" is now shown next to the session name. The entire entry for the stopped session is shown in red color. This is to remind you that the corresponding profiler output in the editor area shows incomplete data.
You can remove any terminated profiler sessions from the Profiler Sessions view.
When you remove a profiler session, this also indirectly causes the collected data for the removed session to be released from memory if nothing else in the Eclipse session is referencing it (for example, profiler output in the editor area).
To remove a profiler session
In the Profiler Sessions view, select the session that you want to remove.
Invoke the context menu and choose .
Beside the interactive profiling from within NaturalONE (see Starting a Profiler Session and Displaying the Output), Natural provides a native profiling on the server side. Native profiling is performed in two steps:
Natural is configured such that the session is profiled and the generated profiling data is written to a resource file.
The profiling data contained in the resource file is read and displayed in NaturalONE.
The profiling of Natural batch applications on the mainframe is
described in detail in the Profiler Utility section of the
Utilities documentation, which is part of the Natural
documentation for mainframes. For non-mainframe environments, please refer to
the documentation for the PROFILER parameter in the
Parameter Reference.
Note:
For mainframe environments, the generation of a resource file
is restricted to batch mode. For non-mainframe environments, native profiling
is generally available. However, if the session is profiled interactively from
within NaturalONE, the PROFILER parameter settings are
ignored and no resource file is generated.
The following topics are covered below:
There are two types of resource files used by the Natural Profiler:
"Flat" resource files (extension .nprf). These contain an individual record for each recorded event. As such, they allow tracing of events in the Event Trace page, in addition to containing the information for the Hot Spots page. However, they can quickly become very large, especially if Natural statements are being traced.
"Consolidated" resource files (extension .nprc). In this case, multiple events are combined into a single file record and the individual event information is not retained. As such, event tracing is not possible and they only contain the information for the Hot Spots page. However, they are invariably very much smaller than the flat files and are thus correspondingly quicker to process.
In mainframe environments, consolidated resource files can be
created by setting the CONSOLIDATE keyword of the Profiler utility
INIT function to ON (see the possible settings for
the CONSOLIDATE keyword described in the Initializing
Profiling in the Profiler Utility section of the
Utilities documentation contained in the Natural
for Mainframes documentation).
In non-mainframe environments, consolidated resource files are
created directly in preference to flat files if the user has specified that
individual events should not be traced (see the possible settings for the
EVENTTRACE subparameter described in the
PROFILER Parameter Syntax in the Parameter
Reference).
The data of a flat resource file can be consolidated and written
to a consolidated resource file with the Profiler utility
CONSOLIDATE function which is available in all environments.
When you open a Natural Profiler resource file, the output is the same as described in Viewing the Profiler Output, with the following restriction: On the Hot Spots page, the direct navigation to a source code line does not work with a Natural Profiler resource file.
Note:
In mainframe environments, the display of resource files must
have been enabled in your Natural Development Server environment (see also
Prerequisites).
To open a Natural Profiler resource file
In the Natural Server view, go to the library to which the resource file was written.
Expand the Resources node of the library and then the NPRF File or NPRC File node.
Select the resource file that you want to open.
Invoke the context menu and choose .
Or:
Double-click the resource file that you want to open.
A profiler session is started and the following occurs:
The profiler output is shown in the editor area. For more information, see Viewing the Profiler Output.
An entry for the program for which you have started the profiler session is shown in the Profiler Sessions view. For more information on this view, see Managing the Profiler Sessions.
When a Natural Profiler resource file is opened, the trace data collected in the resource is transferred to the client. The settings in the Natural preferences are used to filter the data on the client side. For more information, see Profiler in Setting the Preferences.
Note:
The sampling setting for the profiler is ignored when viewing
a Natural Profiler resource file.
When a profiler session has been started, the profiler monitoring
can be paused and restarted from the profiled Natural application by calling
the application programming interface (API) USR8210N. The API can
also be used to get the current state of the monitoring process. The API is
delivered in the SYSEXT library. For more information, see the
description of the SYSEXT utility in the Natural documentation for your
platform.
During a Natural session, different kinds of events can occur, for example, "starting a program". Data specific to an event is collected in a trace record. The following event types are available:
| Event Type | The event occurs ... |
|---|---|
| Session Initialization (SI) | ... when the session is initialized during session startup. |
| Session Termination (ST) | ... when the session is being terminated. |
| Program Load (PL) | ... when a program is loaded or when it is already located in the Natural buffer pool on the server. |
| Program Start (PS) | ... when a program is started. |
| Program Termination (PT) | ... when a program is terminated. |
| Program Resume (PR) | ... when control returns to one program level from another, including the case where control returns to level 0 (no program active). |
| Before Database Call (DB) | ... before a database call is executed. |
| After Database Call (DA) | ... after a database call has been executed. |
| Natural Statement (NS) | ... when a Natural statement is
executed.
For technical reasons, there is no one-to-one relationship between a Natural source code statement and an object code in the cataloged object. Therefore, multiple Natural statements can be merged into one "Natural Statement" event and conversely, one Natural statement can cover multiple "Natural Statement" events. |
| Before Terminal I/O (IB) | ... before a terminal input/output is executed. |
| After Terminal I/O (IA) | ... after a terminal input/output has been executed. |
| Before External Program Call (CB) | ... before an external program call
(CALL statement) is executed.
|
| After External Program Call (CA) | ... after an external program call
(CALL statement) has been executed.
|
| Runtime Error (E) | ... when a Natural runtime error has occurred. |
| User-Defined Event (U) | ... when a user-defined event is
generated using the Natural statement CALL 'CMRDC' 'U' '
some-user-data'. The first byte of the user
data (a blank in this example) is interpreted as the event subtype.
|
| Monitor Pause (MP) | ... when event collection is
temporarily interrupted (for example, because an FNAT program is currently
being executed or because the profiler data pool is full). In addition,
monitoring can be explicitly paused via the application programming interface
USR8210N.
|
The abbreviations which are provided in the above table (behind the event type) are used in the Type column of the profiler's Event Trace page.