This document covers the following topics:
 To set the preferences
From the menu, choose .
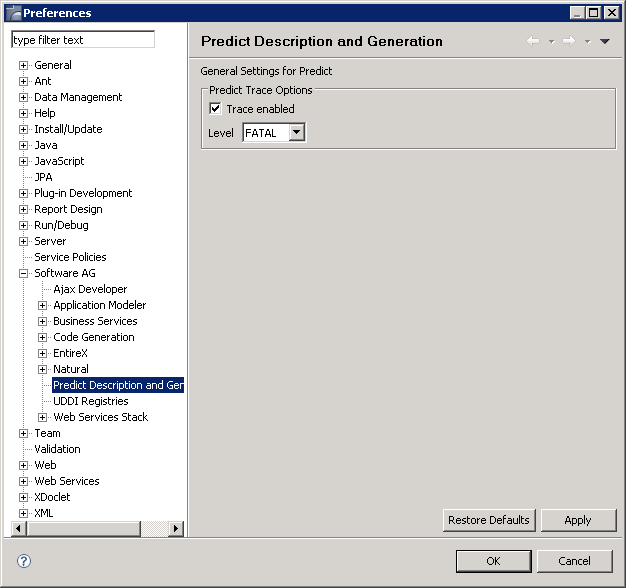
In the tree of the resulting window, expand the Software AG node and select Predict Description and Generation.

Modify the desired values.
Choose the button.
You can enable tracing to troubleshoot configuration and connection issues. This option records what is happening internally within the component.
 To enable tracing
Activate the Enable tracing check box.
Select the desired trace level from the Trace level spin box.
Note:
The trace level names, granularity settings and their following
description are taken from the documentation of the
org.apache.log4j package (Apache Log4j 1.2.16 API) and are
copyright by Apache Software
Foundation.
The following trace levels can be set.
| Level | Description |
|---|---|
FATAL |
The FATAL level
designates very severe error events that will presumably lead the application
to abort.
|
ERROR |
The ERROR level
designates error events that might still allow the application to continue
running.
|
WARN |
The WARN level
designates potentially harmful situations.
|
INFO |
The INFO level
designates informational messages that highlight the progress of the
application at coarse-grained level.
|
DEBUG |
The DEBUG level
designates fine-grained informational events that are most useful to debug an
application.
|
TRACE |
The TRACE level
designates finer-grained informational events than the
DEBUG level.
|
Runtime information will now be provided in the standard Eclipse Console view.
 To show the Console view
From the menu, choose .
The Console view appears.

For information on how to use this view, see the Eclipse documentation.