
Entire Operations logs all important system events. You can view logs specific to an owner, network or job and specify additional information for the log report to be produced.
You can also use the monitoring function to observe all activities currently running in your Entire Operations environment.
The standard system log contains information about activities in the
system as a whole such as user actions, date and time of events and messages
about events. If additional (extended)
information is available for any item on the system log, it is
preceded by an asterisk (*). For details, see
Displaying Extended Log
Information.
This document covers the following topics:
 To display log information
For a single node item:
From the object workspace, select the object whose log you want to see and choose (if applicable) from the context menu.
Or:
For a selected owner and network:
From the object workspace, select the General node and choose .
A Log Display Selection window like the example below opens:
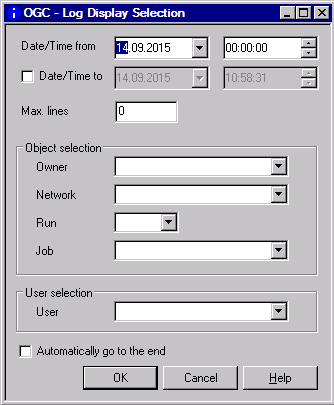
Specify the required selection criteria. The input fields are explained in Fields: Log Display Selection.
Choose .
The logging information is shown in a Browse Log window like the example below:
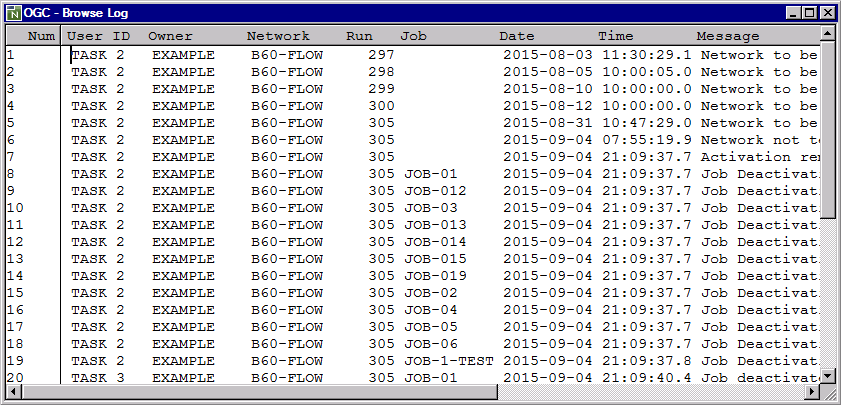
For explanations of the columns, see Columns: Browse Log. The functions of the context menu are described in Available Functions: Browse Log.
The Log Display Selection window provides the following input fields:
| Field/Option | Description |
|---|---|
| Date/Time from | Start date and time for the log
display.
Default: Current date and 00:00:00 for time in the format HH:II:SS. |
| Date/Time to | End date and time for the log display.
Default: Current date and time in the format HH:II:SS. |
| Max. Lines | Maximum number of lines to display in the log.
|
| Owner | Name of the owner whose log is to be displayed.
Select an owner from the drop-down list box or leave the field blank to display the log for all owners. |
| Network | Name of the network whose log is to be displayed.
Select a network from the drop-down list box or leave the field blank to display the log for all networks. |
| Run | Run number or a range of numbers
to be displayed in the log.
Can be used only if an owner and a network are specified. Select a run number from the drop-down list box or leave the field blank to display the log for all run numbers. Default: 1-9999 (all). |
| Job | Job whose log is to be displayed.
Select a job from the drop-down list box or leave the field blank to display the log for all jobs. |
| User | User ID or Monitor task name (or ranges) for which the
log is to be displayed.
Enter (or select) a user ID or
Monitor task name (for example, To display the log for all users and tasks, either leave
the field blank (default) or enter an asterisk only ( |
| Automatically go to end | If this option is selected, scrolls down to the end
of the log report to see the most recent log entries.
This setting can also be specified as a default value in the user profile: see the section User Maintenance in the Administration documentation. |
The Browse Log window contains the following columns:
| Column | Description | ||
|---|---|---|---|
| Num | Log line number. | ||
| User ID | User ID or Monitor task
name.
An ID or name preceded by an asterisk ( For more information, see Displaying Extended Log Information. |
||
| Owner | Owner name in Entire Operations. | ||
| Job | Entire Operations job name. | ||
| Network | Name of the job network. | ||
| Run | Job run number. | ||
| Date | Date of log entry. | ||
| Time | Time of log entry. | ||
| Message | Message text.
Depending on the default display option set (see
List
Display Options in the
Administration documentation), the message text is
prefixed with a message code (if one exists), for example: |
||
The context menu of the Browse Log window provides the following functions:
| Function | Shortcut | Description |
|---|---|---|
| Copy | CTRL+C | Copies the currently selected text. In case some text from the selection is not received from a server, a warning is shown, and the Copy function is not performed. |
| Select All | CTRL+A | Selects all text. |
| Reverse Order | CTRL+R | Shows text in the reverse order. |
| Find | CTRL+F | Finds the text fragment. |
| Find next | F3 | Finds the next text fragment. |
| Go To | CTRL+G | Moves the cursor to the specified line number. |
| CTRL+P | Prints log data. | |
| Refresh | F5 | Refreshes the log with
"time to"=actual time |
| Refresh with new start time | F4 | Refreshes the log with
"time from"=time from the selected row "time to"=actual time |
| Extended Log | CTRL+E | Displays job-specific
extended log
information if available for the log item.
Extended log information is marked with an asterisk
( |
Additional (extended) log information is provided as job-specific data items appended to the standard system log.
An asterisk (*) in the User
ID column of a log item indicates that an extended log is
available for the job listed in this log line.
To display extended log information
In the User ID column of the
Browse Log
window, place the cursor in an item that begins with an asterisk
(*) and choose Extended Log from the context
menu, or press CTRL+E.
Or:
From the object workspace, select an active job and
choose an Extended Log function from the context menu. All
Extended Log functions are described in
Available Functions: Job
Active in the section Maintaining Active Jobs and
Networks.
Or:
From an
Import/Export
window, choose Display.
An Extended Log window like the example below opens:
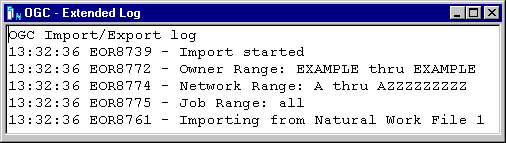
The example contains logs about an import or export operation.
This section covers the following topics:
Extended (additional) information that can be logged for a job are described in the following section.
- JCL
Displays the JCL of a specific job run. The JCL log source is dependent upon the operating system in which the job has run.
Prerequisite for logging: Activate the Log JCL option in the job master definition described in Defining Extended Log Information for a Job in the section Job Maintenance.
- SYSOUT
Displays the SYSOUT of a specific job run.
Prerequisite for logging: Activate the Log SYSOUT option in the job master definition described in Defining Extended Log Information for a Job in the section Job Maintenance.
- Messages
Displays selected messages of a specific job run.
Prerequisite for logging: Define the messages to be logged in the Log System Messages fields of the job master definition described in Defining Extended Log Information for a Job in the section Job Maintenance.
- Active/Pregenerated JCL Modifications
Displays changes made to active or pregenerated JCL of a specific job run.
Prerequisite for logging: Activate the Log the changes made to an active/pregen. JCL option in the Entire Operations default settings described in Defaults: System/Log Files in the Administration documentation.
- Import/Export Processing
You can choose Display from an Import/Export window to view an extended log file containing information on an import or export operation.
Activity monitoring is used to permanently display Entire Operations events that currently occur in your Entire Operations environment.
The following applies to the monitoring feature:
The activity monitoring facility receives its data from the Entire Operations log file.
The activity monitoring facility only displays the most important messages. Error messages and other very important messages appear highlighted.
The default setting displays events starting from the current time.
This section covers the following topics:
To start monitoring and display activities
In the object workspace, select the metanode.
Open the context menu and choose .
An Activity Log window like the example below opens:
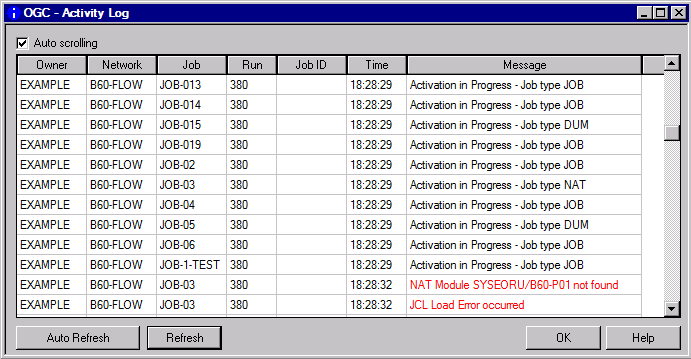
All current activities within Entire Operations are logged and displayed in this window. Error messages are highlighted in red.
The columns contained on the screen are described in Columns: Activity Log.
You can use the Auto Refresh and Refresh options to update the display and modify the update interval. See also Refreshing Object Lists.
You can use the option to automatically scroll to the latest activity.
The columns in the Activity Log window are described in the following table:
| Column | Meaning |
|---|---|
| Owner | Owner of the active network. |
| Network | Name of the active network. |
| Job | Name of the active job. |
| Run | Run number as assigned to the active network by Entire Operations. |
| Job ID | Job identifier as assigned by the operating system or by the job entry subsystem. |
| Time | Last action or check time for the job. |
| Message | Last message issued for
the job by Entire Operations.
For a list of possible messages, see Messages in Active Jobs Lists. |