
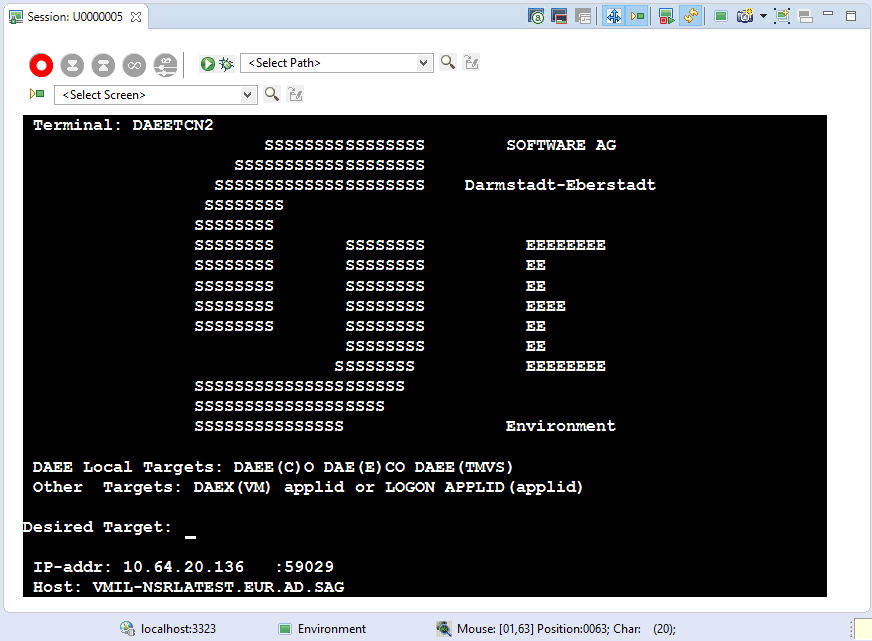
Refer to Creating a Display Session in the Designing and Developing a Test Case documentation. These definitions override the default connection configuration as defined in the test project properties.
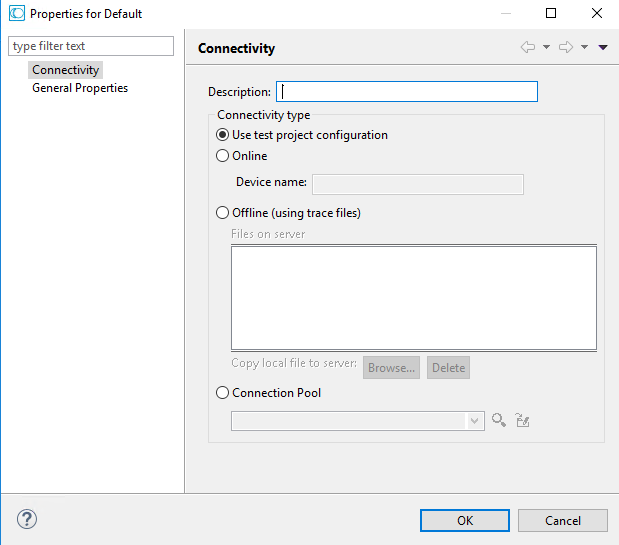
- Description
A suitable description for the session.
- Use test project configuration
Select Use test project configuration to implement the configuration as set in the test project properties.
- Online
Select Online when you want to connect online to the configured host.
- Offline (using trace files)
Indicate whether to simulate a communication with the host by using a pre-recorded file. Select Offline (using trace files) and then select the replay file from the list displayed in the Files on server list or browse and select a file from a folder.
- Connection Pool
Select Connection Pool and choose one of the test project's Connection Pools.
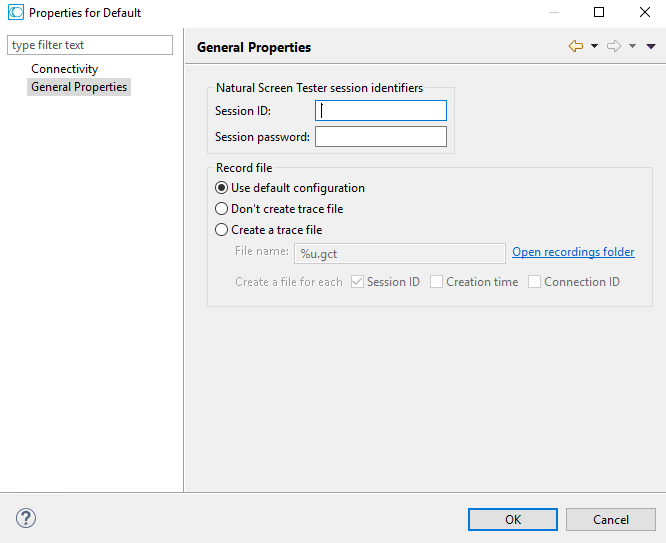
- Session ID
Custom session ID
- Session password
Custom session password.
- Use default configuration
Select Use default configuration to implement the Test Project Trace File configuration as set in the test project properties.
- Don't create trace file
Select Don't create trace file if you do not want to create a trace file.
- Create a trace file
Indicates whether to log the communication with the host into a file. Select Create a trace file and insert the trace file name. If you include %u or %t (or both) in the file name, you can create files for diverse users with different session ID and time information. Check Session ID if you want to override the files of the same session ID. Check time to add a time stamp to the file name. This does not overwrite previous files. Check Connection ID to add full connection ID (test project, connection pool, connection) to the file name.
|
|
Show/hide attributes |
|
|
Show/hide input fields |
|
|
Window: will gray out or display in regular colors, the screen area outside the window. It is not possible to navigate outside the window. |
|
|
Test Case Toolbar |
|
|
Navigate to Screen Toolbar |
|
|
Restart Session |
|
|
Synch with host |
|
|
Character mode/Block mode |
|
|
Change screen direction |
|
|
Update Screen Image |
|
|
Edit the current screen |
|
|
Identify new screen/screen group |
|
|
Automatically identify unprotected screens |
|
|
Screen creation mode: automatic, semi-automatic or manual |
The Test Case Procedure toolbar is used to record, run and debug a test case.
|
|
Start recording |
|
|
Stop recording |
|
|
Mark possible input - marks the input (unprotected) fields of the current screen |
|
|
Mark possible output - marks the fields that will be used as assertions |
|
|
Loop |
|
|
Get loop condition text |
|
|
Run |
|
|
Debug |
The Test Project toolbar is available to be used when developing a test project. Using the toolbar you can:
Check that the test project definitions work as expected (by selecting a screen, and checking that Natural Screen Tester is able to navigate to this screen).
Navigate to a specific screen to edit and make changes in the screen.
The Test Project toolbar is not displayed when working offline.
|
|
Navigate to screen |
|
|
Open the entity's editor |
|
|
Find entity |
|
|
Slider, indicates current location in the replay file. |
|
|
Screen number box, displays the current screen number. |
|
|
Displays a list of the available screens and screen groups. |
|
|
Open the entity's editor |
|
|
Find entity |
|
|
When clicked, displays the screen number entered in the screen number box. |
|
|
Show User Input button displays the user input entered while the replay file was recorded. When the button is clicked, the contents of the input fields that were changed appear in red, a string representation of the host key sent appears in the Toolbar and the cursor is positioned in the position it was in when the screen was sent to the host. |
Note:
When replaying a file that has a Connection Pool, the Replay
Navigator slider is not available for the Natural UNIX protocol.