
The Profiler utility reads and processes Profiler resource files created by the Natural Profiler for UNIX and Windows and Natural code coverage for UNIX and Windows. It provides functions for data consolidation (aggregation), event tracing and program tracing. It offers a program summary, a line summar and a transaction summary and displays the Profiler properties and statistics. For Natural code coverage data, program and statement coverage reports are provided. The resulting data can be exported to a file in text or CSV (comma-separated values) format, or in the format expected by the Natural Profiler MashApp.
Additionally, the Profiler utility provides functions to pause and to restart the Profiler data collection.
The Profiler utility runs in batch mode only.
This document covers the following topics:
The Profiler utility uses technology introduced with the NaturalONE
Profiler such as the NATRDC1 user exit and the Profiler data pool. Therefore,
the processing of the event data is restricted to NaturalONE users who can use
the NaturalONE Profiler and the Profiler utility to evaluate the event data.
The data consolidation and processing functions of the Profiler utility
(CONSOLIDATE, READ, MASHZONE,
LIST and DELETE) have to be activated before they can
be used. The activation is described in
Prerequisites.
This section covers the following topics:
When a Natural application is profiled, the Natural Profiler collects one record for each event. Depending on the application, this can produce huge amounts of data, especially when Natural statements are monitored. The more data the Profiler generates, the more time is required to transport the data from the server to the NaturalONE client.
The Profiler utility offers a server-side data consolidation which
significantly reduces the amount of data while increasing the transport flow
rate. The Profiler data consolidation combines similar records into one
consolidated record containing aggregated time values and a hit counter. The
consolidated data is written to a resource file which has the same name as the
corresponding unconsolidated resource file but an extension .nprc
(Natural Profiler resource consolidated).
During profiling, the data can be consolidated immediately by
switching off the EVENTTRACE subparameter of the
PROFILER parameter. See
PROFILER - Profile a Natural
Session in the Parameter Reference
documentation. Unconsolidated data of an NPRF file can be consolidated
later with the Profiler utility CONSOLIDATE function.
A Natural statement executes 1000 times in a FOR loop. The
unconsolidated data contains 1000 records for each execution of the statement.
Each record contains the event time and the CPU timestamp, besides other
information. The Profiler consolidation combines these 1000 records into one
consolidated record. All common information (like the library or program name)
is kept, the elapsed time and the CPU time of each execution of the statement
is determined, summarized and saved in the consolidation record. Additionally,
a hit count of 1000 is recorded.
Notes:
Natural code coverage is used to monitor executed and not-executed
statements of a Natural application. It is started by switching on the
ACTIVE subparameter of the COVERAGE profile parameter
described in the Parameter Reference documentation.
For code coverage, Natural code coverage automatically uses an event
filter so that only the program information (PI) and Natural
statement (NS) events are collected. The data is automatically
consolidated before it is written to a Natural NCVF resource file.
When the NCVF coverage resource file is analyzed with the Profiler
READ function, the source of the monitored programs is read and
the lines are marked according to the coverage of the statements in the
line.
The following graphic shows how the Profiler utility processes unconsolidated and consolidated data:
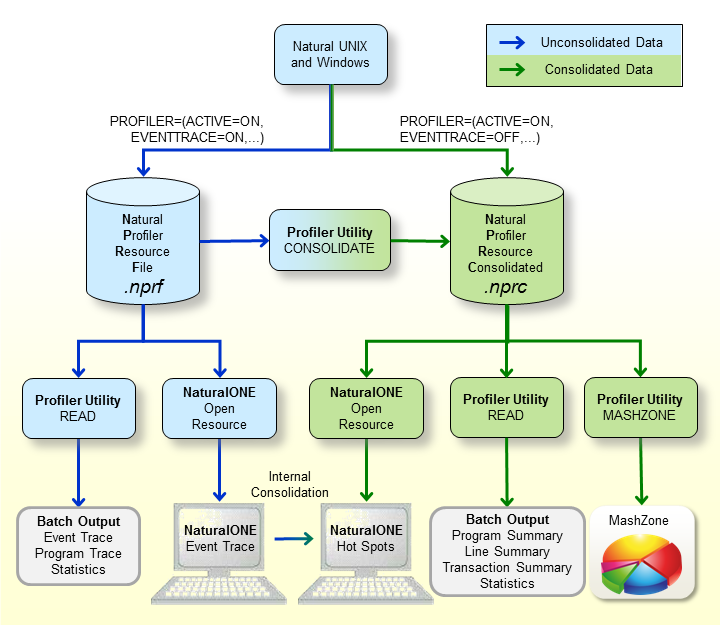
The graphic is explained in the following section:
When a Natural application on UNIX or Windows is profiled by
switching on the ACTIVE subparameter of the
PROFILER profile parameter, the resulting event data is
written to a Natural Profiler resource file (NPRF) or a Natural Profiler
resource consolidated (NPRC) file depending on the setting of the
EVENTTRACE subparameter of the PROFILER
parameter. For EVENTTRACE=ON, the data is written to an NPRF
resource file, for EVENTTRACE=OFF, it is written to an NPRC
resource file.
The Natural Profiler resource file (extension .nprf)
contains the event data in an unconsolidated format, which means that there is
one record for each event.
The Profiler utility READ function reads the
event data from the NPRF resource file. It provides an event trace, a program
trace and the Profiler statistics. The resulting data can be exported to a file
in text or CSV (comma-separated values) format.
If the NPRF resource file is opened from NaturalONE, the unconsolidated event data is listed on the NaturalONE Event Trace page.
The NaturalONE Hot Spots page shows the event data in a consolidated form. If the data derives from an NPRF resource file, NaturalONE consolidates the data internally.
The Profiler utility CONSOLIDATE function reads
the event data from the NPRF resource file, consolidates it and writes it to an
NPRC resource file.
The Natural Profiler resource consolidated file (extension
.nprc) contains the event data in a consolidated format, which
means that similar records are aggregated in one consolidated record. In
general, an NPRC resource file is much smaller than the corresponding NPRF
resource file and, therefore, much quicker to process.
If the NPRC resource file is opened from NaturalONE, the consolidated event data is shown on the Hot Spots page. It is not possible to view the event trace because the NPRC resource file does not contain the data of each single event.
The Profiler utility READ function reads the
event data from the NPRC resource file. It provides a trace of the consolidated
records, a program summary, a line summary, a transaction summary and Profiler
statistics. The resulting data can be exported to a file in text or CSV
(comma-separated values) format.
The Profiler utility MASHZONE function reads the
event data from the NPRC resource file and exports it in CSV (comma-separated
values) format as expected by the Natural Profiler MashApp.
The Natural Profiler MashApp visualizes the Profiler event data and statistics in MashZone.
In general, profilers are classified into event-based or statistical profilers. Statistical profilers, which operate by sampling, interrupt the operating system at regular intervals to receive the profiling data. The resulting data is not exact but a statistical approximation.
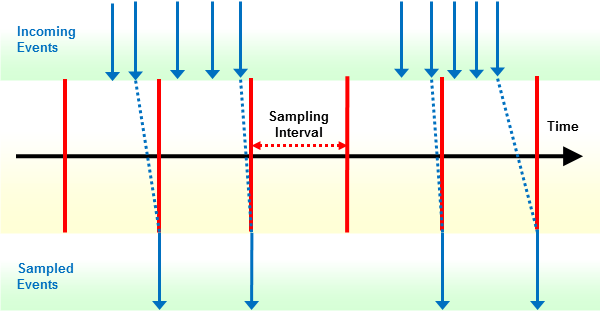
The Natural Profiler is an event-based profiler. It receives control and collects the profiling data whenever a Natural event occurs. Although the Natural Profiler does not interrupt the operating system, it offers a sampling technique that generates the same profiling data as statistical profilers.
Natural Profiler sampling works like a filter: it eliminates all events except the last one in a sampling interval. Additionally, it replaces the event CPU timestamp by the subsequent sampling time. This way, the Natural Profiler only collects those events that were active at the beginning of a sampling interval.
If you use Profiler sampling, consider the following:
Natural Profiler sampling provides a good estimation of the consumed CPU time. It does not provide other estimations such as hit counts, elapsed times, and Adabas times.
Natural Profiler sampling is a statistical approach which reduces the number of events severely with nearly the same CPU time results.
The smaller the sampling interval, the more accurate the result.
The higher the sampling interval, the less data is produced.
The resulting event duration is a multiple of the sampling interval.
The sampling generates at most one record per sampling interval.
Events which spent more time than a sampling interval need one record only.
The session termination (ST) event is recorded
unchanged.
If the total application CPU time is known and sampling is used, the number of events can be estimated:
Number of events ≈ |
|
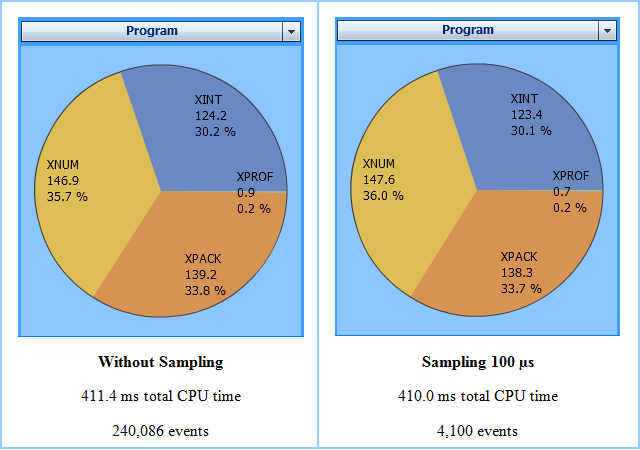
In the following example application, the program XPROF
calls three subprograms. The application is profiled twice:
Without sampling.
With sampling whereby a sampling interval of 100 microseconds is used.
For sampling, the following subparameters of the
PROFILER profile parameter are used:
PROFILER=(ACTIVE=ON,SAMPLING=ON,INTERVAL=100)
The Natural Profiler MashZone pie charts below show for each program the name of the program, the CPU time spent (in units of milliseconds) and the CPU time percentage with respect to the total CPU time. The left chart reflects the run without sampling and the right chart the run with sampling. Although the number of events has been reduced by the sampling to about 1.7 percent, the resulting CPU time and distribution are nearly the same.
Profiling a long-running batch application can produce a huge amount of data, especially when Natural statements are monitored.
This section describes how to minimize the number of events to be monitored while keeping essential information:
If a Natural session executes multiple Natural applications, pause the Profiler for applications which are not of interest and restart it for applications of interest.
Eventually, use the application programming interface (API) to start and pause profiling at specific points in the application.
A Natural batch session executes three Natural applications. From these three applications, only the second one is of interest for a Profiler analysis.
Pause profiling before the first application executes, start profiling before the second application executes, and pause profiling again before the third application executes as in the example below:
PRFPAUSE
APP-01
PRFSTART
APP-02
PRFPAUSE
APP-03
FIN
/*
This way, profiling only affects the second application and has no
impact on the performance of the other applications. Note that the programs
PRFPAUSE and PRFSTART have to be copied into the user
library.
Statement events have the most impact on the performance and quantity. The other events have only a low impact on the performance but enlarge the quantity. Monitor statement events only if you really need them. Monitor from the non-statement events only those you want to analyze.
For example, if you want to view in NaturalONE the program hot spots
but neither the statement nor the line hot spots, the following setting of
the PROFILER profile
parameter is sufficient:
PROFILER=(ACTIVE=ON,EVENT=(S,P),...)
With this setting, only the program and session events needed for the program hot spots are monitored.
For the CPU analysis of a long-running application, we recommend sampling. If you use already filter settings to reduce the number of events, you can additionally activate sampling to reduce the number of events further.
Most event data is generated when statements are collected. Therefore, sampling will often be used in conjunction with statement collection. For very long-running applications, however, it might be helpful to use sampling even if no statements are collected. If you use sampling without statement collection, we recommend a sampling interval that is higher than that specified when statements are collected.
Sampling has only restricted impact on the Profiler performance but it can reduce the amount of data dramatically. The formula in the section Sampling rearranged here can be used to choose a sampling interval so that the number of events is equal to or less than an approximate value:
Sampling interval ≥ |
|
For example, a batch application requires 40 minutes of CPU time (2,400,000,000 µs). Sampling should restrict the number of events to at most 500,000 events. The corresponding sampling interval can be calculated with the formula above.
Sampling interval ≥ |
|
= 4,800 |
Set the PROFILER profile parameter as
follows:
PROFILER=(ACTIVE=ON,SAMPLING=ON,INTERVAL=4800)
See PROFILER - Profile a Natural Session in the Parameter Reference documentation.
If you want to analyze the performance of the event data and do not require an event or program trace, we recommend that you consolidate the event data on the server side. The Profiler data consolidation combines similar records into one consolidated record containing aggregated time values and a hit counter.
The event data can be consolidated during data
collection by switching off the EVENTTRACE subparameter of the
PROFILER profile parameter. See
PROFILER - Profile a Natural
Session in the Parameter Reference
documentation.
Unconsolidated event data of an NPRF (Natural Profiler resource file)
resource file can be consolidated with the Profiler utility
CONSOLIDATE function as described in the section
Consolidating Event
Data.
Consolidated data is written to an NPRC (Natural Profiler resource consolidated) resource file which is in general significantly smaller than the corresponding NPRF resource file. It opens much faster from NaturalONE and provides the same hot spots as the NPRF resource file.
Note:
Natural code coverage data written to an NCVF resource file is
automatically consolidated by Natural code coverage.
The Natural Profiler for UNIX and Windows is activated
with the PROFILER profile
parameter described in the Parameter Reference
documentation.
The use of the Profiler utility can be controlled by Natural Security, see Protecting Utilities in the Natural Security documentation.
The use of the NaturalONE Profiler and NaturalONE code coverage is described in the NaturalONE documentation.