The debugger takes over control of a Natural session for debugging purposes while a Natural object is executing. This allows you to follow the process flow of a program and perform various program investigations.
You can specify the places in a program where you want the debugger to pause by setting debug entries (breakpoints or watchpoints) for that program.
When program execution pauses, you can review the contents of the variables or parameters used in the program to analyze the program logic, or you can determine the reason for a Natural error.
This section provides general information on the functionality of the debugger.
The debugger obtains control over a Natural session when test mode
is set to ON (see Switch Test Mode On and
Off). If the profile parameter
DBGERR is
set to ON (see the Parameter Reference
documentation) the debugger is invoked when a Natural error occurs,
irrespective of any debug entries and the test mode setting (ON or
OFF).
When the debugger controls a session, the debugger performs one or more of the following functions:
Checks debug entries.
Interrupts a Natural object at a statement line for which a breakpoint was set.
Interrupts a Natural object when the value of a variable for which a watchpoint was set has changed.
Displays information on the debug entries (watchpoint and/or breakpoint) found.
Provides statistics on the Natural objects called.
Provides statistics on the statements executed in a Natural object.
Interrupts a Natural object when a Natural error occurs. See also the section Error Handling.
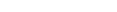
The following graphic illustrates an example of the process flow when a Natural object is executed with the debugger:
Debug entries are also referred to as spies in the debugger environment. Two types of debug entries (spies) are available: breakpoints and watchpoints.
The following topics are covered below:
Debug entries for the current debug session can be set, modified, listed, displayed, activated, deactivated and deleted by using the appropriate debugger maintenance functions described in the relevant sections of the debugger documentation. Debug entries can also be saved for future use as described in Debug Environment Maintenance.
The validity check of debug entries is either performed immediately when a breakpoint or watchpoint is defined on the appropriate maintenance screen or during program execution.
If a validity check fails during program execution, the note
Check for invalid spy definition appears in the
Debug Break window (see
Debug Break
Window). In addition, the invalid breakpoint or watchpoint
is marked on the relevant breakpoint or watchpoint maintenance screens.
When a debug entry is set or modified, Natural internally stores the library, database ID and file number where the object is located. The object may be located in the current library or in one of its steplibs. If an object of the same name is later executed from another library, the corresponding debug entry is not executed.
The debugger assigns a name and a unique number (spy number) to each debug entry. The name assigned to a debug entry (also referred to as spy name) can be either a name specified by the user or a default name created by the debugger. A debug entry can be selected by its number with the corresponding debugger commands. If more than one debug entry has to be executed at a specific statement line, they are executed in ascending order of their numbers.
Each debug entry has an initial state and a current state.
Possible values are A (active) and I (inactive). The
initial value is specified when setting or modifying the breakpoint or
watchpoint and determines the state of the debug entry at environment start or
after reset. During the debug session, the state can be changed with the debug
commands ACTIVATE and
DEACTIVATE (see also the syntax diagrams in
Command Summary and
Syntax).
Each debug entry has an event count, which is increased every time the debug entry is executed. A debug entry is not executed if the current state is inactive. The event count of the breakpoint or watchpoint is not increased either.
The number of executions of a debug entry can be restricted in two ways:
A number of skips can be specified before the debug entry is executed. The debug entry is then ignored until the event count is higher than the number of skips specified.
A maximum number of executions can be specified, so that the debug entry is ignored, as soon as the event count exceeds the specified number of executions.
For each debug entry (breakpoint or watchpoint), up to six debug
commands can be specified. These commands are executed at execution time of the
breakpoint or watchpoint. You can use all debugger commands that can be applied
during a debug interrupt. The default command is the
BREAK command, which displays the Debug
Break window as shown in the following section.
Caution:
If you delete the BREAK command
when setting a debug entry and you do not enter any command that issues a
dialog, there is no way to assume control during program
interruption.
When the debugger obtains control of the session, a Debug Break window similar to the example below appears:
+------------------- Debug Break -------------------+ ! Break by breakpoint DEBPGM-ALL ! ! at line 180 in program DEBPGM (level 1) ! ! in library SAG in system file (10,32). ! ! ! ! G Go ! ! L List break ! ! M Debug Main Menu ! ! N Next break command ! ! R Run (set test mode OFF) ! ! S Step mode ! ! V Variable maintenance ! ! ! ! Code .. G ! ! Note: Check for invalid spy definition. ! ! ! ! PF2=Step,PF13=Next,PF14=Go,PF15=Menu,PF17=SkipS ! +---------------------------------------------------+ |
The Debug Break window shows the type and name of the debug entry that has caused the break (that is, the name of the corresponding breakpoint or watchpoint), its source-code line number, and the name of the interrupted Natural object.
In addition, at the bottom of the Debug Break window, messages may appear that either indicate a Natural error (see also Errors during Application Execution in Error Message Handling) and/or the possibility of an invalid debug entry.
The functions provided in the Debug Break window are described in the following table. For further details, see Execution Control Commands.
| Function | Code | Description |
|---|---|---|
| Continues the execution of the Natural object up to the next debug entry specified. | ||
| Lists the code of the Natural object currently active. The last statement executed is highlighted. | ||
| Invokes the Debug Main Menu which provides all functions needed to maintain debug entries at which control is to be assumed. | ||
| Executes the next command specified for the current breakpoint or watchpoint. | ||
| Continues the execution of the Natural object with test mode set off. | ||
| Continues the execution of the Natural object in step mode. | ||
| Displays the variables in the Natural object currently active and modifies the contents of these variables. |