This document covers the following topics:
With one of the next versions, remote debugging will no longer supported. Instead, you will have to use the debugger which is integrated in Natural Studio.
Remote debugging is done when you debug a native Natural for UNIX application from a Windows computer.
To enable remote debugging, you have to proceed as follows:
Install the debug front-end on a Windows computer. This also installs
the remote debugging service natdbgsv which must be active for
remote debugging. See Installing the Remote
Debugger.
Define the parameters RDNODE,
RDPORT
and RDACTIVE in the
environment which contains the application that is to be debugged. See
Setting Up Your
Environment for Remote Debugging for further
information.
Invoke the debugger by entering the system command
DEBUG
                     object-name
in the
environment which contains the application that is to be debugged.
The following topics are covered below:
Important:
For running the remote debugger, the Microsoft Windows Personal
Firewall must be deactivated. See
Configuring the
Microsoft Windows Personal Firewall to Run Natural in the
Operations documentation for Natural for
Windows.
If you have Natural for Windows installed, you must use the remote debugger delivered with Natural for Windows. If the remote debugger has not yet been installed, use the Modify option of the Natural installation package to add the remote debugger to your Natural for Windows installation. See Maintaining Your Natural or Natural Runtime Environment in the Installation documentation for Natural for Windows.
You only need to install the remote debugger stand-alone, if you do not have Natural for Windows installed. If you want to you debug a Natural application which is stored on a UNIX platform, copy $NATDIR/$NATVERS/dbrmt/I386/nrd.exe from the UNIX installation medium to your Windows computer (for example, to a temporary directory) and unzip it. Run setup.exe to start the installation of the remote debugger.
The following topics are covered below:
Either install the remote debugger (the corresponding files can be
found on the UNIX installation medium) or install Natural for Windows (the
remote debugger can optionally be installed with a Natural for Windows custom
installation; see the
Installation documentation for Natural
for Windows). This also installs the Natural remote debugging service
natdbgsv.
To uninstall the remote debugging service, enter natdbgsv
-u in the command line. To view the current service's port name
and version, enter natdbgsv -s. To re-install the
service on a different port, uninstall it first and then enter
natdbgsv -i portnumber,
where portnumber is the value of the
RDPORT
profile parameter. If the port number is already used, a dialog appears where
you can enter a new port number.
Note:
Before you install the remote debugging service on a port other
than 2600 (default value), you have to change the value of the
RDPORT profile parameter to match the port number of the
client computer where the Natural application is being debugged.
Install the remote debugger (the corresponding files can be found on
the UNIX installation medium) or install Natural for Windows (the remote
debugger can optionally be installed with a Natural for Windows custom
installation; see the
Installation documentation for Natural
for Windows). This also creates the debugger shortcut in the
menu (in the same programs folder in which you can
find the shortcuts for Natural) which represents the listener process
natdbgsv. To use remote debugging, natdbgsv must be
started. The first time the listener process is launched in a specific user
session, a free port number is displayed which must be entered in the
corresponding field of the RDPORT profile
parameter.
Any subsequent activation of natdbgsv causes the listener
to be started with the same port number. If this number is already used by a
different application, then the user must provide natdbgsv's port
dialog with a new port number and RDPORT must be
adjusted accordingly.
Start Natural with the following profile parameter settings:
RDACTIVE set to
"ON".
RDNODE set to the
node name of the Windows server.
RDPORT set to
"2600" or another port number: the number of either
port with which you have installed the remote debugging service (see
Windows
Side without Terminal Services), or with which port the
listener process was started (see
Windows Side
with Terminal Services).
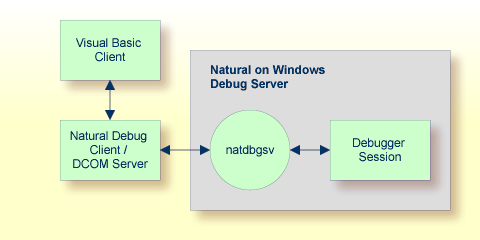
There are different scenarios of how you can use remote debugging: A single Natural client runs under the control of one remote debugging session or a distributed Natural application runs under the control of several remote debugging sessions. Such a distributed application may include both Natural RPC and DCOM servers or even components not written in Natural, such as Visual Basic clients.
The following topics are covered below:
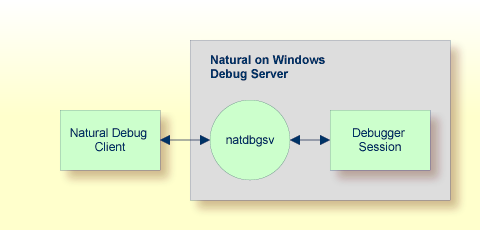
The diagram below illustrates debugging in a single Natural application.
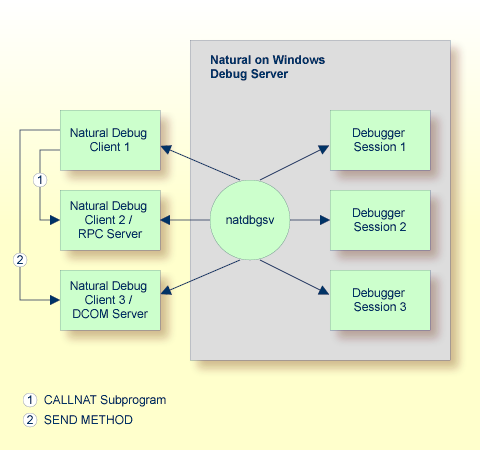
To debug each component of the following distributed Natural
application, you enter DEBUG
objectname in the command line of
Natural debug client 1. The first time the Natural Debug Client calls a
subprogram on a Natural RPC server, a new debug session is opened for the RPC
server. Then, the RPC server's processing is debugged. The debug session is
closed as soon as the RPC server is terminated.
The same applies to a Natural DCOM server.
As in the previous scenario, the first time a method on the DCOM server is called, a new debug session is opened for the DCOM server, the DCOM server's processing is debugged, and the debugger session is closed as soon as the DCOM server is terminated: