
When the debugger has been started, additional elements are available in the Natural Studio window.
The title bar of the Natural Studio window shows one of the following:
[break]
When "[break]" is shown in the title bar,
the debugger has control.
[running]
When "[running]" is shown in the title bar,
the Natural application currently being debugged has control.
When you are debugging an object in a remote environment using SPoD, the title bar also shows the port number of the host.
The commands in the menu apply to the debugger.
As long as the debugger has not been started, only the command is enabled in the menu. When the debugger has been started, the remaining commands in the menu are enabled and the command is shown instead of the command.
When an editor window is active and the debugger has been started for the object in this window, the context menu shows commands which apply to the debugger. As long as the debugger has not been started, only the debug command is available in the context menu.
Detailed descriptions of these commands are provided later in this documentation.
The debugger has a special toolbar which provides fast access to the commands available in the menu. As long as the debugger has not been started, only the toolbar buttons for the commands and are enabled in the Debug toolbar. When the debugger has been started, all other toolbar buttons are enabled.
The buttons in the Debug toolbar represent the following menu commands:
|
|
(only shown when the debugger has not yet been started) |
|
|
(only shown after the debugger has been started) |
|
|
|
|
|
|
|
|
|
|
|
|
|
|
|
|
|
|
|
|
|
|
|
The display of the Debug toolbar can be switched on and off. See Customizing Natural Studio in the Using Natural Studio documentation for further information.
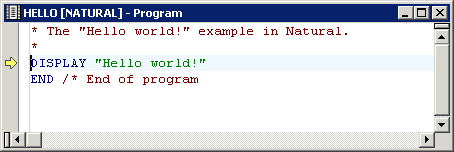
The current trace position is indicated by an arrow in the left margin of the editor window.
When the debugger is started, the trace position is shown at the first executable source code line. Example:
When you have scrolled the editor window so that the trace position is no longer visible, you can return to the trace position as described below.
Note:
See also Returning to
the Object with the Current Trace Position.
![]() To return to the trace position
To return to the trace position
From the menu, choose .
Or:
Press ALT+NUM*.
Note:
NUM* is the key on the numeric keypad which is used for
multiplication.
Or:
When the Debug toolbar is shown, choose the following toolbar
button:
![]()
When the debugger has been started, the following windows are shown:
Each tab of a debugger window offers a context menu which contains either the commands which can be used in combination with the entire tab (when an entry is not selected) or the commands which can be used with the selected entry. These commands are described later in this documentation.
The debugger windows are moveable and dockable. See Dockable Windows in the documentation Using Natural Studio.
Note:
When the display of the debugger window has previously been switched
on using the corresponding command in the menu, this
debugger window (which shows the breakpoints and watchpoints that have been
defined in the active environment) will be replaced by the debugger windows
described below. See also
Debugger
Window in the documentation Using Natural
Studio.
This window shows all variables which are available at current state of the program execution.
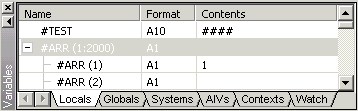
An expand or collapse toggle to the left of the variable name indicates
a group, an array or redefined field. The toggle for a redefined field
additionally contains an "R" (for example:
![]() ).
).
The variables are grouped in different categories. A tab is provided for each category:
Locals
Shows the local variables used in the active generated program.
Globals
Shows the global variables of the referenced global data area.
Systems
Shows all system variables on the current platform. For example, when
you are currently debugging an application in a mapped UNIX environment, all
system variables which are valid for UNIX are shown.
AIVs
Shows the currently available application-independent variables
(AIVs) in the application.
Contexts
Shows the currently available context variables in the
application.
Watch
Shows the variables that you have added yourself in order to watch
them. See Adding a
Watchvariable.
You can switch between the display of the different types of variables by choosing the corresponding tab at the bottom of the variables window.
See Modifying and Watching Variables for further information.
![]() To switch the variables window display on and off
To switch the variables window display on and off
From the menu, choose .
Or:
Press CTRL+ALT+1.
When the variables window is displayed in the Natural Studio window, a check mark is shown next to this menu command.
![]() To activate the variables window using a shortcut key
To activate the variables window using a shortcut key
When the variables window is displayed in the Natural Studio window, press CTRL+SHIFT+V to activate it.
This window shows all currently defined breakpoints and watchpoints.
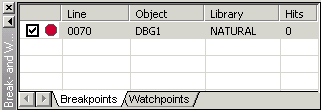
You can switch between the display of the watchpoints and breakpoints by choosing the corresponding tab at the bottom of the break- and watchpoints window.
See Setting Breakpoints and Watchpoints for further information.
![]() To switch the break- and watchpoints window display on and off
To switch the break- and watchpoints window display on and off
From the menu, choose .
Or:
Press CTRL+ALT+2.
When the break- and watchpoints window is displayed in the Natural Studio window, a check mark is shown next to this menu command.
![]() To activate the break- and watchpoints window using a shortcut
key
To activate the break- and watchpoints window using a shortcut
key
When the break- and watchpoints window is displayed in the Natural Studio window, press CTRL+SHIFT+B to activate it.
This window shows the objects which have been called during the current debugging session in hierarchical order.
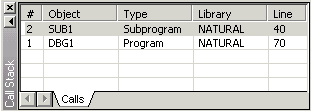
See Using the Call Stack for further information.
![]() To switch the call stack window display on and off
To switch the call stack window display on and off
From the menu, choose .
Or:
Press CTRL+ALT+3.
When the call stack window is displayed in the Natural Studio window, a check mark is shown next to this menu command.
![]() To activate the call stack window using a shortcut key
To activate the call stack window using a shortcut key
When the call stack window is displayed in the Natural Studio window, press CTRL+SHIFT+C to activate it.