This document covers the following topics:
The HTML Monitor Client is a monitor interface that supports any web browser as a user interface for monitoring the various types of servers that are provided in a mainframe Natural environment. Each of these servers has its own set of monitor details which are described in the corresponding server documentation. The HTML Monitor Client enables you to list all existing servers and to select a server for monitoring.
To run the HTML Monitor Client, any server must host an HTTP Monitor
Server. The HTTP Monitor Server is a subtask that can run in any Natural SQL
Gateway server address space and is configured with the configuration parameter
HTPMON_PORT and HTPMON_ADMIN_PSW.
An HTTP Monitor Server is accessible through a TCP/IP port number and can
monitor all servers running on the current node (for SMARTS: running within the
current SMARTS). Although it is not necessary, you can run multiple HTTP
Monitor Servers on one node. But each one needs an exclusive port number.
Open your web browser and connect the HTTP Monitor Server using the
following url:
http://nodename:port,
where nodename is the name of the host
on which the Natural SQL Gateway server hosting the monitor is running. And
port is the port number the
administrator has assigned as the monitor port in the configuration file.
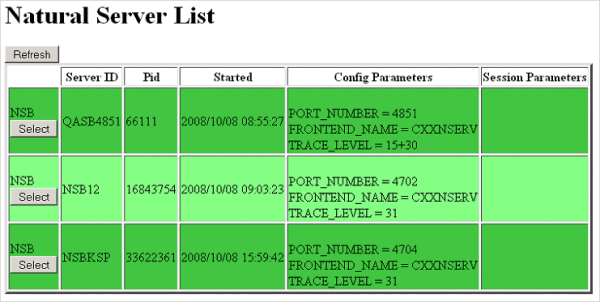
Example:

The server list consists of green and red entries. The red ones represent potentially dead server entries which can be deleted from the server directory by choosing the attached button. The button appears only for the red entries. "Potentially dead" means, that the HTTP Monitor Server "pinged" the server while assembling the server list, but the server did not answer within a 10 seconds timeout. Thus, even if you find a server entry marked red, it still might be active but could not respond to the ping. Choosing the button does not terminate such a server but removes its reference in the monitor directory. Hence, it cannot be reached by the monitor anymore.
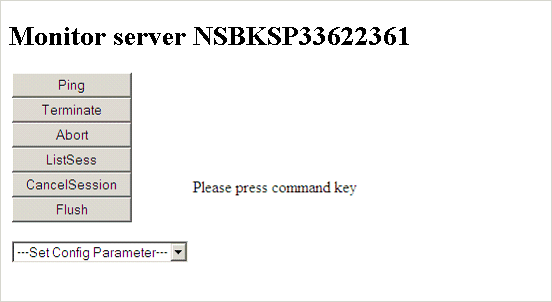
Choosing the button opens a window for monitoring the selected server.
Example:

With the buttons, you can perform the labeled monitor commands.
The selection box allows you to modify the server configuration parameters. If you select a parameter for modification, it has a predefined value. This predefined value does not reflect the setting of the server. It is just a sample value.
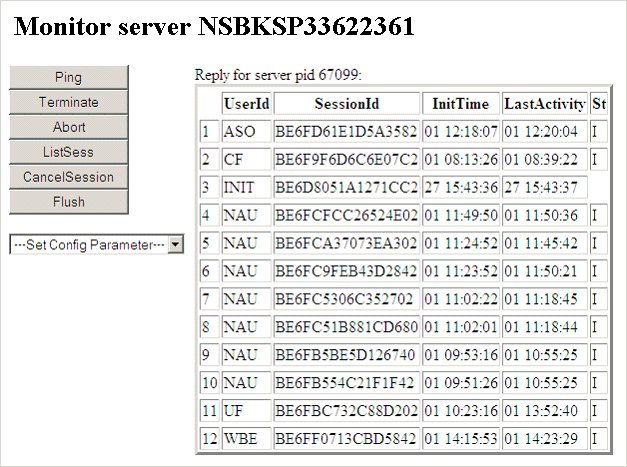
If you choose the button, a list of all Natural sessions appears in the window, for example:

You can cancel sessions by selecting the session ID in the SessionId column and choosing the button.