Natural Monitor (NM) provides response time reporting and
user activity analysis for Natural applications running under the Customer
Information Control System (CICS).
Within Natural Monitor, most statistics are gathered for a transaction, which occurs each time Enter or a PF key is pressed.
The major features of Natural Monitor include the following:
Response Time Reporting Subsystem
Provides transaction reports and response time graphs for a
user-specified time interval.
If specified, the user may also generate the following displays for a specific report:
Detailed Records Display
Provides response time information about a user's transactions that
exceed a user-defined response time threshold.
Transaction Summary
Provides information about transaction usage and performance.
Transaction summary information is available for Natural at the application
level.
Historical Snapshots
Provides pictures of data at previous times. These pictures, similar to
the display of current data, are generated for specific time intervals. Anyone
who defines reports can collect history data.
Summary of Active Users
Shows the usage of system resources by users who are currently logged on
and active in Natural.
Technical Information
Displays environmental information including history session
information.

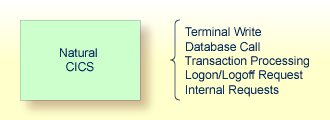
The figure above shows significant monitoring points between Natural and Natural Monitor. The Natural Monitor user interface allows the user to display data from these various monitoring points to evaluate performance and fine tune the system.
This section covers the following topics:
![]() To access the Natural Monitor System menu
To access the Natural Monitor System menu
Type NM on the command line in the Natural Review
Main Menu and press Enter.
The menu appears as shown below:
 10:12:22                 ***** REVIEW NM UTILITY *****               2006-03-02
                                  - NM Main Menu -


                        Code  Function

                         RT   Response Time Subsystem
                         SA   Summary of Active Users
                         TE   Technical Information


   Command ===>
   Enter-PF1---PF2---PF3---PF4---PF5---PF6---PF7---PF8---PF9---PF10--PF11--PF12---
         Help        Exit                                                  Canc
|
The functions shown on the menu are described in the following table:
| Code | Function | Description |
|---|---|---|
RT |
Response Time Subsystem | Provides information about response times experienced by Natural end users and about heavily used Natural transactions. Reports may also be displayed indicating which Natural transactions are being most heavily used. |
SA |
Summary of Active Users | Displays information about the system activity of Natural users who have logged on since the last initialization of CICS. |
TE |
Technical Information | Displays environmental information including history session information and control. |
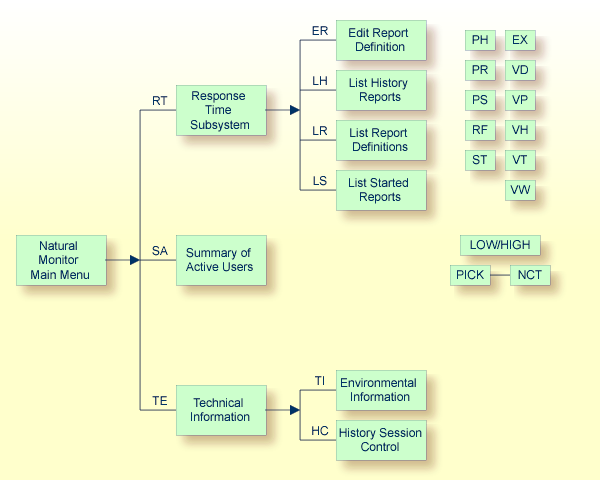
The Natural Monitor System menu includes three primary functions and one subsystem:
A primary function consists of one or more screen displays.
A subsystem consists of several subfunctions.
The subsystem is labeled as such. The other items on the menu are primary functions.
The subsystem and the primary functions are reflected in the menu structure of Natural Monitor. The following is a diagram of the Natural Monitor system and the function codes used to access each function.
注意:
See Function Codes and
Commands for a discussion of all function codes, PF keys,
and commands used within Natural Monitor.

Natural Monitor uses the Natural system file (FNAT) and the
Natural Monitor repository for storing data:
The Natural system file (FNAT) is used for storing the
user profiles.
The Natural Monitor repository is an Adabas file used for storing response time report definitions and historical data.
Historical data are available for viewing as historical snapshots of previously collected data. Natural Monitor captures historical data only for the Natural Monitor Response Time subsystem. The method used to access historical data is described in section Using Response Time Reports.