
This document covers the following topics:
The HTML Monitor Client is a monitor interface that supports any web browser as a user interface for monitoring the various types of servers that are provided in a mainframe Natural environment. Each of these servers has its own set of monitor commands which are described in the corresponding server documentation. The HTML Monitor Client enables you to list all existing servers and to select a server for monitoring.
To run the HTML Monitor Client, any server must host an HTTP Monitor Server. The HTTP
Monitor Server is a subtask that can run in any Web I/O Interface server address space. It
is configured with the NWO server configuration parameter
HTPMON_PORT and HTPMON_ADMIN_PSW. An HTTP
Monitor Server is accessible through a TCP/IP port number and can monitor all servers
running on the current node (for SMARTS: running within the current SMARTS). Although it
is not necessary, you can run multiple HTTP Monitor Servers on one node. But each one
needs an exclusive port number.
Open your web browser and connect the HTTP Monitor Server using the following URL:
http://nodename:port,
where nodename is the name of the host on which
the Natural Development Server hosting the monitor is running. And
port is the port number the administrator has
assigned as the monitor port in the NDV configuration file.
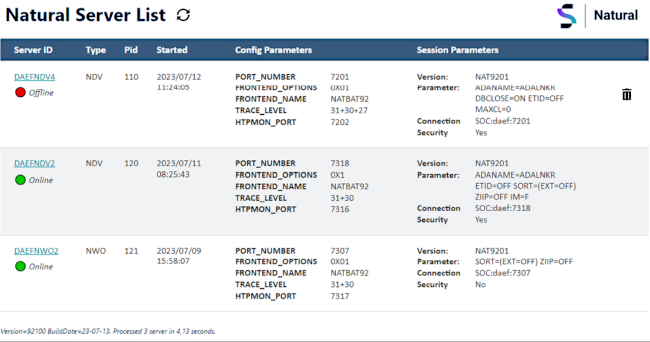
The server list consists of online and offline servers. The offline servers represent potentially dead server entries which can be deleted from the server directory by choosing the icon. appears only for offline servers. "Potentially dead" means that the HTTP Monitor Server "pinged" the server while assembling the server list, but the server did not answer within a 10 seconds timeout. Thus, even if you find a server entry marked offline, it still might be active but could not respond to the ping. Choosing does not terminate such a server but removes its reference in the monitor directory. Hence, it cannot be reached by the monitor anymore.
Choosing a link of the server ID opens a window for monitoring the selected server. Clicking the link with the left mouse button opens the server in a popup window. Clicking the link with the right mouse button opens the server monitor either in a new tab or in a new browser window, depending on the selection in the context menu.
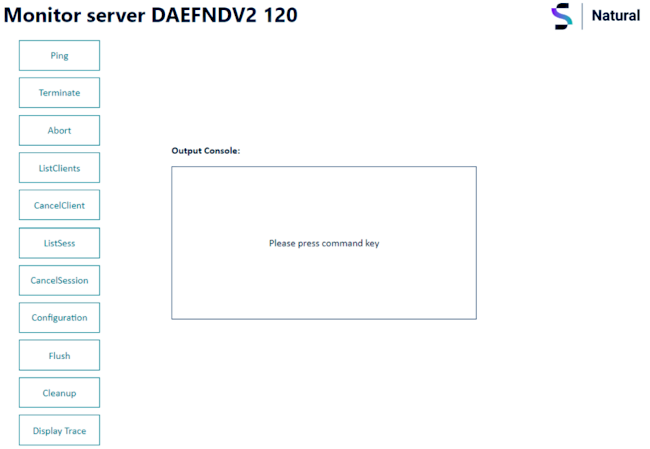
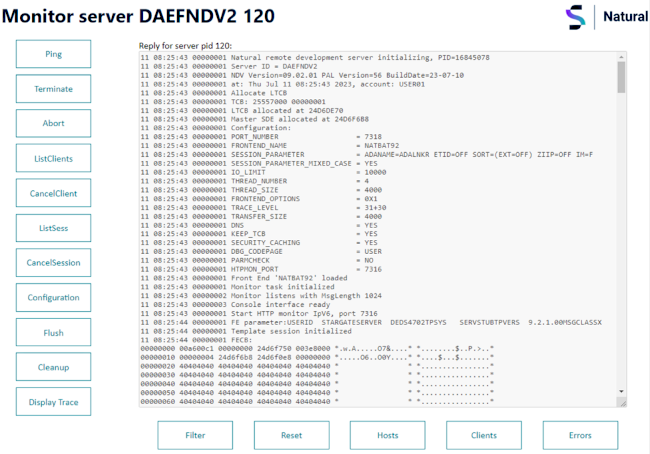
With the buttons, you can perform the labeled monitor commands.
The selection box allows you to modify the server configuration parameters. If you select a parameter for modification, it has a predefined value. This predefined value does not reflect the setting of the server because it is a sample value.
If you choose , a list of all Natural sessions appears in the window, for example:
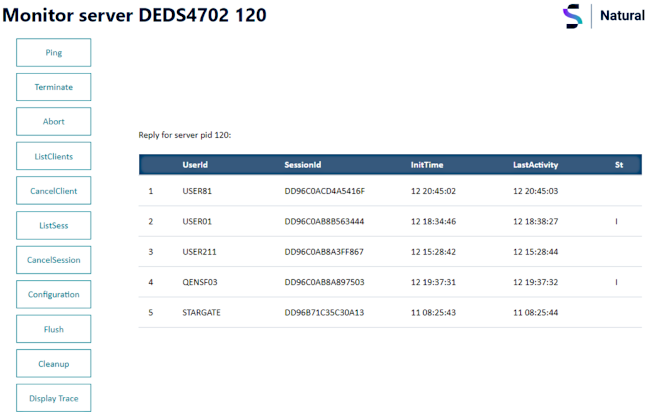
You can cancel sessions by selecting the session ID in the SessionId column and choosing .
shows currently connected sessions. Connected sessions are either permanent connections to Natural Studio or temporary connections to NaturalONE. In case of NaturalONE, a connected session is a session that currently executes a Natural session (for example using Run As/Debug As), waits on an I/O screen or uses the Natural Command Console for Mainframes.
In conjunction with Security Caching (see parameter SECURITY_CACHING in the documentation of Natural Development Server) the following buttons are available:
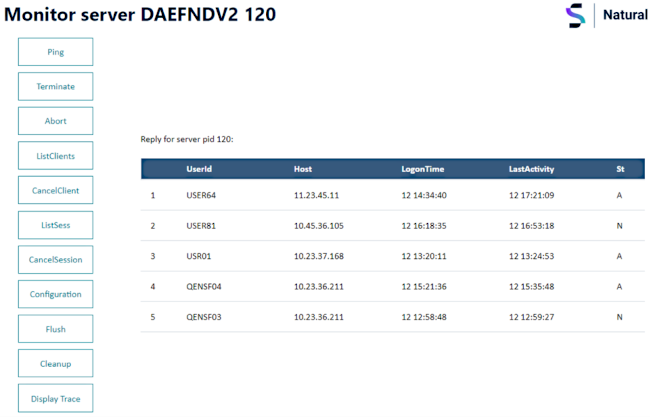
ListClients displays the clients that are logged in, including the following information (from left to right):
Number of client entry
UserId - UserId of the client
Host - IP Address of the client
LogonTime - Time of first login of the client
LastActivity - Time of last access of the client
St - Status of the client:
A - Client successfully validated by RACF
N - Client not validated by RACF
CancelClient deletes a client and forces a new password prompt. To delete a client from the list, select the number assigned to the client and choose CancelClient, or enter the number of the client after choosing CancelClient.
provides basic filter functions for the trace output of a server. The trace output is loaded completely into a HTML page. In case of very large trace files, loading the files might load with a delay. To refresh the content of the trace, for example if new lines were written, press again.
Each trace line consists of day number, time, thread ID, and message text. The thread ID is an increasing number starting with 0 or 1 (main thread). Each new thread gets a new ID. The main thread starts several new threads like HTTP Monitor, Console Interface, or Main Listener. Each request from a client (like NaturalOne) creates a new thread. Therefore, it is possible to filter particular client sessions.
You can also use well-known browser functions, such as cut and paste or find, to navigate inside a trace.
Filter
Enter a text to filter the trace. Only lines containing the filter text are displayed.
Reset
Filter value is being reset. The entire loaded trace is displayed again.
Hosts
Predefined filter that shows the IP address and, if known, the name of all hosts that had logged into the Server. You can now, for example, display the progress of a particular session by selecting a thread ID and clicking the button.
Clients
Predefined filter that shows the name of clients that had logged into the Server. As in the previous function, you can now, for example, display the progress of a particular session by selecting a thread ID and clicking the button.
Errors
Predefined filter that shows errors that occur on the Server. You can now, for example, display the progress of a particular session by selecting a thread ID and clicking the button.
Example:
Filter trace for clients, select the thread ID of a particular client session, and click . You will see all trace lines of this particular client session.
