The Monitoring part of Cloud Container enables you to monitor the health and availability of the solutions and run-time instances, alerts and alert statuses. You receive an email whenever there is a condition that might affect the solution.
Monitoring Solutions
The monitoring of a new solution starts automatically 10 minutes after the creation of the solution. The data of the solution is collected and analyzed every 60 seconds.
You can access the monitoring pages from the left-side navigation menu of the Monitoring main page.
You can filter the information on most Monitoring pages based on time. To specify the time-range, select a value in the time-range selector.
The following table describes the options in the time-range selector.
Option
Description
1h
Displays the information for the last 1 hour.
6h
Default. Displays the information for the last 6 hours.
12h
Displays the information for the last 12 hours.
24h
Displays the information for the last 1 day.
2d
Displays the information for the last 2 days.
1w
Displays the information for the last 1 weeks.
2w
Displays the information for the last 2 weeks.
4w
Displays the information for the last 4 weeks.
To navigate to the Monitoring main page, log in to webMethods Cloud Container, and select Monitoring in the webMethods Cloud Container navigation bar.
Dashboard
On the Dashboard page, you can view:
The health of the solutions
The number of the alerts that have been raised for all the solutions
The landscape view of the solutions, and the number of alerts for all run-times that are part of the solutions
The following table provides more information about the panes on the Dashboard page.
Pane
Description
Overall KPI Status
Shows the following information about the health of the solutions for the selected time range:
Total number of solutions
The number of healthy solutions
The number of unhealthy solutions
The health of the solutions, as a percentage value calculated by the formula (Number of healthy solutions / total number of solutions) * 100
A healthy solution is a solution which does not have any critical alerts. An unhealthy solution is a solution which has at least one open or resolved critical alert. To see more information about the KPI status of the solutions, click More Details.
Alerts
Shows the total number of open and resolved alerts that have been raised for all solutions for the selected time-range, and the number of alerts from each type: critical, warning, or information. To see more details about the alerts, click More Details. For more information about the alert types, see Alert Types.
Landscapes
Displays the topology of the solutions and the number of alerts for each run-time type since the solution has been activated. The Update in progress link indicates that the solution is under maintenance. Click Update in progress to see more details about the update.
By default, the page displays information for the last 24 hours. To view the information for a different time period, use the time-range selector. For more information about the time-range selector, see Monitoring Solutions.
Solutions
On the Solutions page, you can check the health of the run-time instances from all the solutions. For each run-time instance, you can view the current data, and the data for the last 24 hours.
The health metrics are grouped into three categories:
Memory - indicate the memory utilization of a run-time.
Uptime - indicate the availability of a run-time.
Failures- indicate failures of the run-time
The following table describes the icons on the Solutions page.
Icon
Description
Normal health of the run-time instance.
The health of the run-time instance is deteriorating. Take preventive measures.
There are critical issues with the health oh the run-time instance. Your urgent attention is needed.
The run-time instance is not available.
Note: If the solution uses an Integration Server cluster, the number of Integration Server instances is indicated in brackets after the Integration Server instance name.
During an update of a solution, the Solutions page does not display status icons for the run-time instances from the solution. To view more details about the solution update, click Update in progress.
To view more details about a run-time instance on the Runtime page, click the name of the run-time instance.
Runtimes
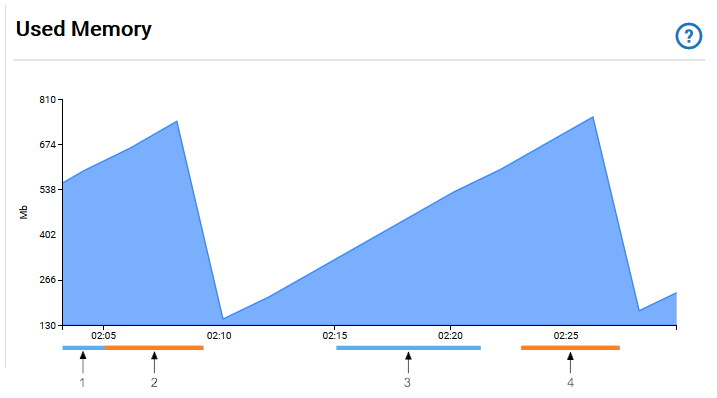
On the Runtimes page, you can view the graphs for monitored KPIs for the selected run-time instances from all the solutions.
The example image shows the graph for the Used Memory KPI. The horizontal lines below the graph represent the severity and duration of the alerts that were raised for the KPI. The information alerts are displayed in blue, the warning alerts are in orange, and the critical alerts are in red.
The following table describes the meaning of the alert lines from the example graph for the Used Memory KPI.
Time Period
Details
1
Until 2:05 h, there had been an open information alert.
2
At 2:05 h, the severity of the information alert was changed to warning.
3
An information alert existed during that period.
4
A warning alert existed during that period.
You can change the value in the Solutions drop-down field to load the information about the run-time instances from a specific solution.
You can use the INTEGRATION SERVER, UNIVERSAL MESSAGING, and TERRACOTTA tabs to view the information related to the selected solution and runtime.
By default, the page displays information for the last 24 hours. To view the information for a different time period, use the time-range selector. For more information about the time-range selector, see Monitoring Solutions.
The following table describes the monitored Integration Server KPIs.
Name
Description
Used Memory
The total used memory for the Java VM.
Service Threads
The number of active service threads.
Sessions
The number of active licensed sessions.
Stateful Sessions
The number of the current stateful HTTP sessions.
The following table describes the monitored Universal Messaging KPIs.
Name
Description
Free Memory
The amount of free memory that the Realm Server has within the Java VM. This indicates the difference between what the Java VM has currently allocated and what the Realm Server has used.
Published Events
Total number of events published on this realm from the time it started.
Subscribed Events
Total number of events that this realm has sent to clients from the time it started.
The following table describes the monitored Terracotta KPIs.
Name
Description
Off-Heap Used Memory
Shows the amount of off-heap memory that is currently used.
Live Objects
Shows the total number of live objects in the cluster, mirror group, server, or clients. If the trend for the total number of live objects goes up continuously, clients in the cluster will eventually run out of memory and applications might fail. Upward trends indicate a problem with application logic, garbage collection, or the tuning of one or more clients.
Viewing Adapter KPIs
On the Runtimes page, you can view the KPIs for the adapters that are installed on the Integration Server instances.
Navigate to the Runtimes page.
Select a solution.
On the INTEGRATION SERVER tab, select an Integration Server instance.
Click Connectivity KPIs.
On the ADAPTERS tab, select an Adapter. The Adapter KPIs are displayed.
The following table describes the monitored Adapter KPIs.
Name
Description
Connections
The number of connection pools in the adapter and how many of them are currently enabled.
Notifications
The number of adapter notifications (polling notifications) and how many of them are currently enabled.
Note: You can view Adapter KPIs only for the current time.
Viewing Connector KPIs
On the Runtimes page, you can view the KPIs for the connectors that are installed on the Integration Server instances.
Navigate to the Runtimes page.
Select a solution.
On the INTEGRATION SERVER tab, select an Integration Server instance.
Click Connectivity KPIs.
Click the CONNECTORS tab.
Select a provider.
Select a connector. The Connector KPIs are displayed.
The following table describes the monitored Connector KPIs.
Name
Description
Connections
The number of connection pools in the connector and how many of them are currently enabled.
Listeners
The number of connector listeners and how many of them are currently enabled.
Note: You can view Connector KPIs only for the current time.
Services
On the Services page, you can view the number of successful and failed service executions of the Integration Server instances from the solutions.
The Services page consists of the Service Executions pane and the History pane.
Pane
Description
Service Executions
Shows the following information about the service executions of the Integration Server instances for the selected time range:
Total number of service executions
The number of successful service executions
The number of failed service executions
The successful service execution, as a percentage value calculated by the formula (Number of successful service executions / total number of service executions) * 100
History
Shows a chart with the history of successful (green) and failed (red) service executions. Hovering over the green and red bars displays the total number of successful and failed service executions, correspondingly.
The numbers of service executions on the Services page includes the public and internal services of the Integration Server instance and their child services.
You can change the value in the Solutions drop-down field to view the information about a specific solution, or the information for all solutions.
By default, the page displays information for the last 24 hours. To view the information for a different time period, use the time-range selector. For more information about the time-range selector, see Monitoring Solutions.
Uptime
On the Uptime page, you can view time lines that represent the availability of all run-time instances of the solutions.
The color of the time lines changes based on the status of the run-time instances.
The following table describes the meaning of the different colors.
Time line color
Indicates that
green
the run-time instance was available during the indicated time period.
red
the run-time instance was unavailable during the indicated time period.
grey
the run-time instance did not exist during the indicated time period.
blue
at least one node from the cluster is unavailable.
yellow
a solution update is in progress (the solution is under maintenance).
Note: If the solution uses an Integration Server cluster, the number of Integration Server instances is indicated in brackets after the Integration Server instance name.
By default, the time line displays the availability of the instances during the last 24 hours. To view the information for a different time period, use the time-range selector. For more information about the time-range selector, see Monitoring Solutions.
Alerts
The alert is a notification that a rule is violated.
On the Alerts page you can:
View the number of critical, warning, and information alerts for all the solutions for the selected time range
Filter the alerts by solution, runtime, severity, and status
Configure the rules by adjusting the alert threshold values
Configure the summary of the alerts
Configure the recipient email for the alerts. For more information about configuring the alerts, see Configuring the Alerts
By default, the Alerts page displays the number of alerts (critical, warning, and information) for all the solutions, and detailed information about the alerts in a tabular format.
Note: If the duration of the rule violation is less than the time interval at which the rule is evaluated, the alert does not appear on the Alerts page. For more information about the interval, see Configuring the Alerts.
If you deactivate a solution, the Alerts page will not display the alerts for the solution.
If you activate a solution, the Alerts page will display both the historical alerts for the solutions that had been raised before the deactivation of the solution, and the alerts that were raised after the activation of the solution.
When a solution update starts, the existing active alerts for the solution are set to resolved. During the update period, no alerts are generated for the solution. You can disregard any email alerts that you receive during the upgrade period.
The following table describes the information that is displayed in the table on the Alerts page.
Column
Description
Solution
Name of the solution.
Runtime
Run-time type.
Integration Server
Universal Messaging
Terracotta
Instance
Name of the run-time instance.
Start Date
Date and time when the alert was raised.
Resolved On
Date and time when the alert was resolved. The field is empty if the alert is still active.
Message
Description of the alert.
Status
Status of the alert.
The alert is inactive.
The alert is active.
Note: The Alerts page might not display the alerts for all nodes from a cluster. For example, if you monitor an Integration Server cluster with two Integration Server instances, and both instances have alerts for the same property with different severity, the Alerts page will show the alert of lower severity only, as explained in the following table.
Integration Server instance
Alert type
Visibility on the Alerts page
Integration Server instance 1
Information. Free memory is low.
Yes
Integration Server instance 2
Warning. Free memory is low.
No
You can view all alerts for all the nodes from the cluster in the email alerts.
By default, the page displays information for the last 1 hour. To view the information for a different time period, use the time-range selector. For more information about the time-range selector, see Monitoring Solutions.
Alert Types
The following table provides more information about the alert types.
Note: Warning alerts and information alerts are not available for KPIs that monitor the availability of a run-time instance.
Alert Severity
Description
Color Coding
Critical
A condition exists that is critical for the system performance.
red
Warning
A condition exists that might deteriorate the system performance.
orange
Information
A condition exists that might evolve into a warning or critical alert.
blue
Configuring the Alerts
You can change the default threshold values and the recipient email for the system alerts. Threshold values determine when a rule is violated and when the system raises an alert.
To configure the system alerts
1.Navigate to the Alerts page.
2.Select the CONFIGURATION tab. The Configuration page shows information about the alerts for all solutions. The following table describes the columns in the form.
boundary values
Column
Description
Name
Alert Name.
Runtime
Integration Server, Universal Messaging, or Terracotta.
Action
The icon activates the configuration view for the alert.
3.Click the Edit this rule icon in the Action column for the alert that you want to configure. A form with the configuration details for the alert rule is displayed. The following table describes the fields in the form.
Field
Description
Threshold
The KPI’s boundary values. When the value of the KPI is outside the range that is specified by these boundary values, the alert is raised. You can configure the threshold values of critical alerts by adjusting the ends of the red line. You can configure the threshold values of warning alerts by adjusting the ends of the orange line. You can configure the threshold values of information alerts by adjusting the ends of the blue line. Note: The Threshold field is read-only for KPIs that monitor the availability of a runtime instance.
Runtime
Integration Server, Universal Messaging, or Terracotta.
Summary
Summary of the alert.
Interval
The scrape interval. The scrape interval is the frequency at which the system collects the data. The scrape interval is 60 seconds for all rules. Read-only. Note: The alert does not appear immediately when the corresponding rule violation occurs. The time delay from the actual time of the rule violation to the system alert is the following:
up to 70 seconds for run-time availability rules of critical severity
up to 420 seconds for run-time availability rules of information severity
up to 180 seconds for the rest of the rules
The system will not send an alert if the rule violation condition is resolved during the corresponding delay period.
Email on alert
Email of the user who will receive the alerts. Note: The email is used for all rules. In case there are alerts, the system sends emails once every 10 minutes. The email alerts always display UTC time. To configure more than one email, use comma-separated values.
4.In the Threshold field, change the default threshold value(s) for the alert.
5.In the Email on Alert field, type the email(s) of the user(s) who will receive the email alerts for all rules.
Note: webMethods Cloud Container stores the email(s) in the local alertManager.yaml file. When you uninstall webMethods Cloud Container or delete a tenant, the related information is deleted automatically.
6.Click Apply.
Alert Actions
You can take actions and resolve the problems with the solutions that caused the alerts. The following table relates the alert with the probable cause of the problem, and the recommended actions that you can take to resolve the problem.
Alert Name
Probable Cause
Action to Resolve the Alert
ISFreeMemoryLow
The memory usage is reaching the configured thresholds. If the memory usage is continuously reaching 95% and above, and you do not observe any flaw in your application, then probably there is another memory-intensive application.
Allocate more memory to the solution.
ISRuntimeSessionUsageHigh
The solution uses too many sessions and there might not be free sessions for new requests.
Try one of the following: - Stop some unnecessary services, if any - Increase the maximum number of active licensed sessions - Move some of the workload to another solution
ISRuntimeStatefulSessionUsageHigh
The number of the current stateful HTTP sessions is high. There might not be enough bandwidth for new sessions.
Move some of the workload to another solution.
ISRuntimeUnavailable
Integration Server is down.
Try one of the following: - If the Integration Server went down because of a high workload, create an Integration Server cluster. - If the Integration Server went down because of insufficient memory and you also get a memory alert, allocate more memory for Integration Server.
TCOffHeapMemoryLow
The heap-off memory has reached the threshold because of too much stored data.
Stop adding data or delete some data from the heap-off memory.
TCRuntimeUnavailable
The Terracotta server went down, or there was a human mistake (for example, somebody shut down the Terracotta server).
Restart the Terracotta server. For greater safety and security, start with the server that was shut down last.
UMRuntimeUnavailable
The Universal Messaging server is down.
Restart the Universal Messaging server. If the problem persists, contact the Software AG Global Support.
UMFreeMemoryLow
The memory usage is reaching the configured thresholds. If the memory usage is continuously reaching 95% and above, and you do not observe any flaw in your application, then probably there is another memory-intensive application.
Increase the memory for Universal Messaging.
Logs
The Logs page (Monitoring > Logs) gives you an access to download various logs of Integration Server and Universal Messaging within the webMethods Cloud Container.
There are two logs view associated with webMethods Cloud Container:
Download: Allows you to view and download the past logs of Integration Server, Universal Messaging, and BigMemory Max within the webMethods Cloud Container.
Browse: Allows you to view logs message statistics and logs details, such as log timestamp and message text. You can change the type of log details that you see by adding or editing filters as described in the Kibana documentation.
Note: By default, webMethods Cloud Container displays the logs accessed from Download.
To view the runtime logs of Integration Server of the same day, you use the Integration Server admin console (Solutions > Manage > Administration).
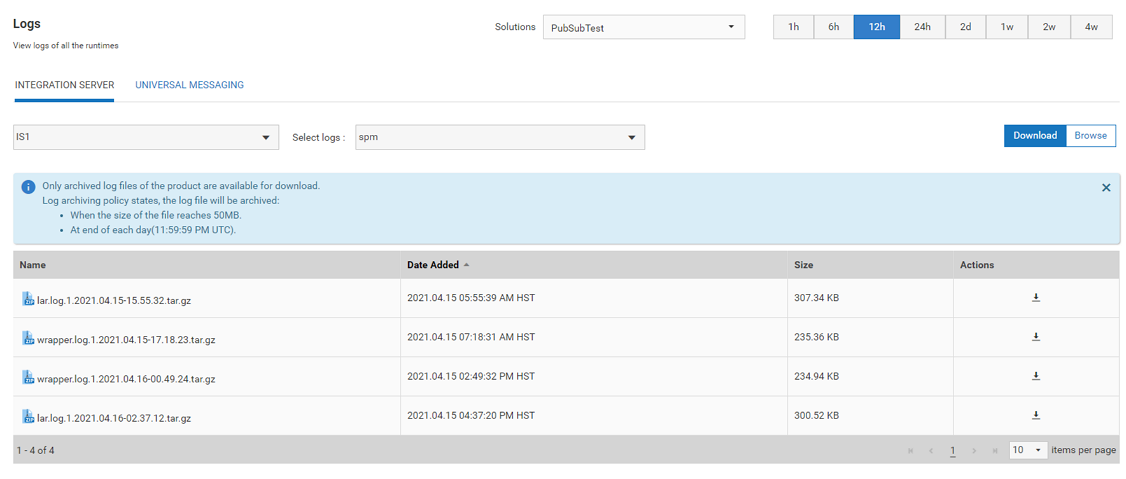
Viewing and Downloading the logs for a specific run-time instance in a solution for a product
Here is an example on how to view and download the logs for a specific run-time instance in a solution for Integration Server.
Select a time period from the time-range selector.
By default, the page displays the logs for the last 1 hour. To view the logs for a different time period, use the time-range selector. For more information about the time-range selector, see Monitoring Solutions.
Select a solution from the top dorop-down list box.
The list box displays all the active solution available in the landscape model. The active solution that we selected has two products Integration Server and Universal Messaging.
Select Integration Server.
You will see all the available instances for this product in the drop-down list.
Select a run-time instance and click the Download button.
You can view logs details, such as the log file name, the date when the log file was created, and the size of the log file. To download the log details, click the icon under Actions. webMethods Cloud Container downloads one file at a time. Multi-select option is not enabled for downloading the log files.
You can view specific log lists by using filters. The filters are provided on the top levels of the log results based on the folders available in the product. By deselecting any filter, you can remove the log results from the list.
Note: By default, the retention period for old logs is 30 days or four weeks (4W), which means that you can view and download only the 30 days log file details.


 icon under Actions. webMethods Cloud Container downloads one file at a time. Multi-select option is not enabled for downloading the log files.