Using built-in functions
Following is an example of using a built-in function:
1. Open the file tutorial-function-sum.rtv by selecting Data Functions on the tutorial main page.
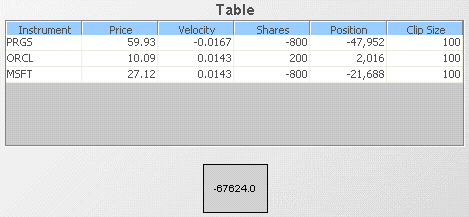
Here the value in the label at the bottom of the dashboard is the sum of the Position variables of each scenario instance. To recreate this sample follow the following steps.
2. Open the file tutorial-summary-table.rtv by selecting Summary Table on the tutorial main page.
3. From the Tools menu select the Functions item to display the Functions panel.
4. Click on the Add button to display the Edit Function dialog.
5. Set the Function Name field to PositionTotal and the Function Type field to Add All Rows Or Columns.
For information on all builtin functions, see
Dashboard Function Reference.
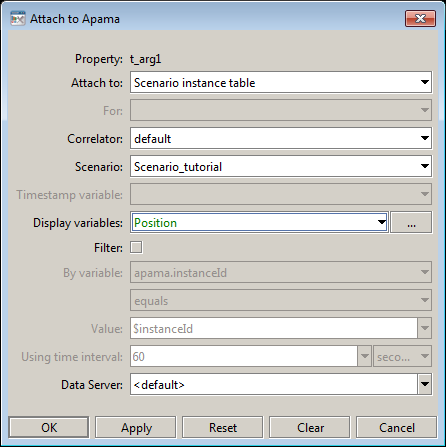
6. Right click on the Table field in the Edit Function dialog and attach it to Apama by specifying the information shown in the dialog shown below.
Here the attachment specifies that the Position column for the tutorial scenario is to be used. The Sum function will produce the sum of the values in all the cells of a given column; in this case the sum of the cells in the Position column for all instances of the scenario.
7. Click OK in the Edit Function dialog and close the Functions dialog.
The function PositionTotal has now been defined and object properties can be attached to it.
8. From the Labels tab in the Object Palette, select the second label object and add it to the dashboard canvas.
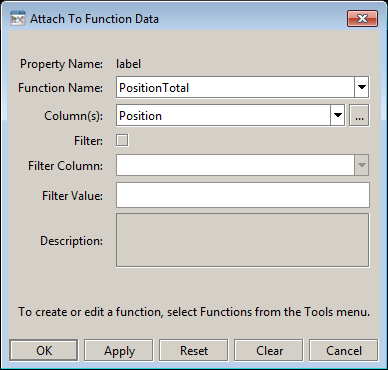
9. Select the label object and in the Object Property panel right click the valueString property and select Attach to Data | Function to display the Attach to Function Data dialog.
10. In the Attach to Function Data dialog select the PositionTotal function as follows:
The label object is now attached to the PositionTotal function and will display the sum of the Position variable for all instances of the scenario.
For more information on the Functions panel and the Edit Function dialog, see
Introduction to Dashboard Functions.
Dashboard Builder provides many functions for operating on data. These can be used to operate on scenario data to produce scalar results such as a sum. They can also be used to produce tabular results which can be displayed as tables or charts. It is also possible to chain functions where one function takes as its input value the output of another function. For more information, see the Dashboard Function Reference in Developing Apama Applications.
Apama also gives you the ability to define custom dashboard functions, as described in the next section.


