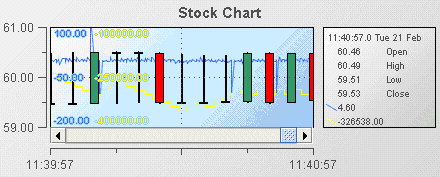
Recreating the Stock Chart Overlay sample
To recreate the Stock Chart Overlay sample:
1. Open the file tutorial-stock-chart.rtv by selecting Stock Chart on the tutorial main page.
2. Select the stock chart and in the Object Properties panel, select the property overlayCount and change its value to 1. This will cause the overlay1 properties to be added to the property panel.
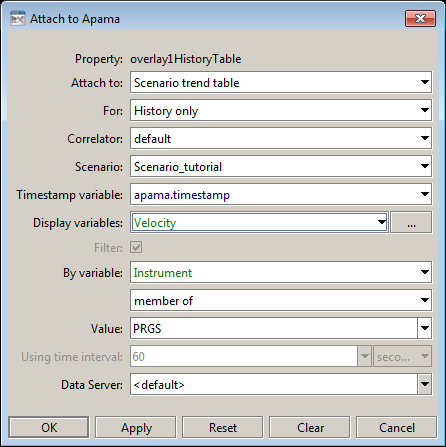
3. Double click on the overlay1HistoryTable property and attach it to a scenario OHLC table by specifying the following information.
The overlay is now attached to Velocity property of the scenario instance where the Instrument equals APMA; this is the same filter used for the priceTraceHistoryTable attachment.
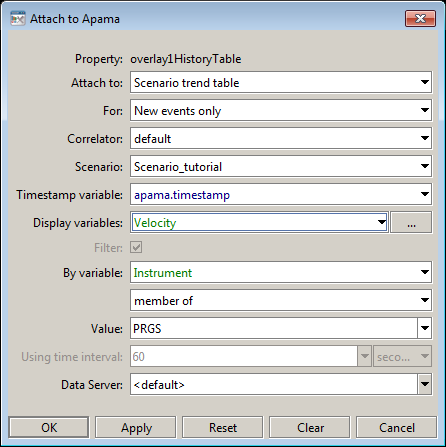
4. Double click on the overlay1CurrentTable property and attach it to a scenario OHLC table by specifying the following information.
The overlay is now attached to Velocity property of the scenario instance where the Instrument equals APMA; this is the same filter used for the priceTraceHistoryTable attachment.
5. Select the overlayCount property in the property panel and change its value to 2. This will cause the overlay2 properties to be added to the property panel.
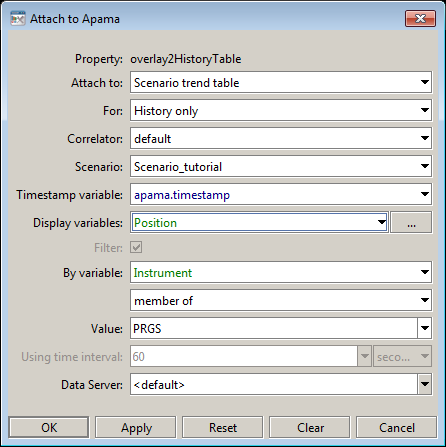
6. Double click on the overlay2HistoryTable property and attach it to a scenario trend table by specifying the following information:
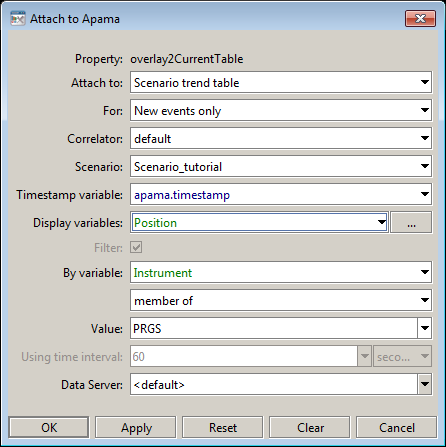
7. Double click on the overlay2CurrentTable property and attach it to a scenario trend table by specifying the following information:
The stock chart now contains two overlays; one showing the velocity of the stock price and the second showing the current position in that instrument. The following illustration shows how this looks in the sample.
Overlays can be hidden by tuning off the overlayNVisFlag property. This is for use when building dashboards where you will have input controls such as checkboxes which will allow the user to hide or show different overlays.
