Description of Management and Monitoring Console
Apama’s Management and Monitoring console enables coordinated management and monitoring of an entire Apama platform deployment. The console provides two basic components:

Centralized control service, with incorporated dashboard

Sentinel agents, running on each distributed node
The Management and Monitoring console is where you configure management policies. The Management and Monitoring component uses the sentinel agents to implement these policies on the distributed machines.
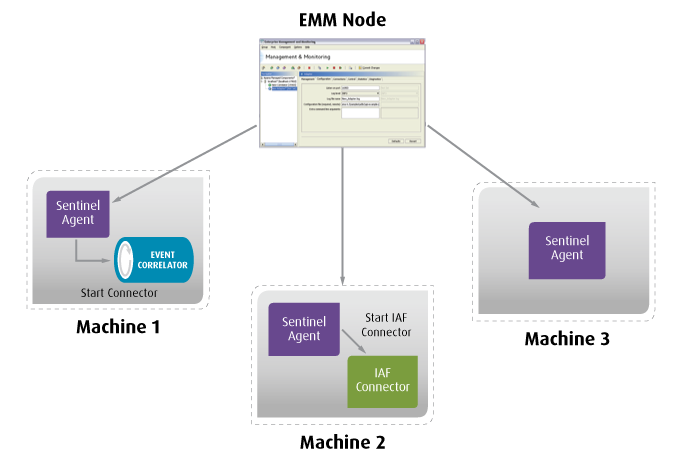
The following figure illustrates this. At the top of the figure, is the client machine that is running the Management and Monitoring component. This is the control node. The other three machines in the figure are running the sentinel agents. The control node uses the sentinel agents to start, shut down, recover and configure correlators, adapters, and Apama client applications.
The capabilities of the Management and Monitoring console are as follows:

Distributed start up and configuration of components. Each sentinel controller can create components such as correlators and IAF adapters. You can use the Management and Monitoring console to configure and start a set of components, for example, three correlators.

Component health monitoring and failure detection. Each Apama component provides an interface, through which the Management and Monitoring console can regularly ping to ensure the component is up and performing properly. Failure to receive an appropriate response can indicate the failure of a component. This capability is configurable, since some applications require higher levels of fault tolerance than others.

Component recovery. It is possible to set up automated policies to restart failed components. For correlators, this might involve the restoration of checkpointed state.

Component shut down. It is possible to shut down components centrally through the Management and Monitoring console.
