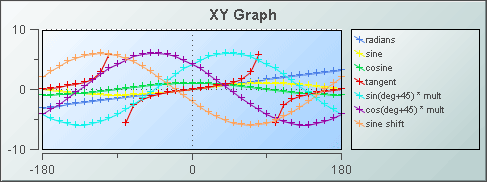
XY graph
XY graphs visualize tabular data that has at least two rows with two or more numeric columns. An XY graph can visualize data in either of two ways:

Row series visualization: The graph has one trace for each non-first row of the visualized data. (The first row is used for the x components of the plotted points, as described below.) Within each trace, there is a plotted point for each column of the data.
For a given point in a given trace, the x component is the value of the point’s corresponding column for the first row of the visualized data, and the y component is the value of that column for the trace’s corresponding row.

Column series visualization: The graph has one trace for each numeric column of the visualized data, except for the first numeric column. (The first numeric column is used for the x components of the plotted points, as described below.) Within each trace, there is a plotted point for each row of the data.
For a given point in a given trace, the x component is the value of the first numeric column for the point’s corresponding row, and the y component is the value of the trace’s corresponding column for the point’s corresponding row.
Use the
valueTable property to attach data to an XY graph. Use the
rowSeriesFlag property to specify row series or column series visualization.
When an XY graph is selected in the Builder canvas, the Object Class Name that appears at the top of the Object Properties pane is obj_xygraph.
The Object Properties panel organizes XY graph properties into the following groups:
