Trend graphs
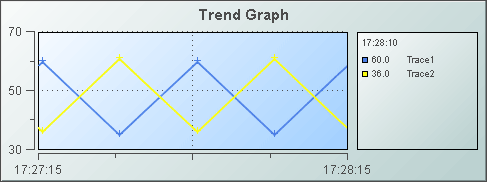
Trend graphs visualize live and historical, time-indexed, quantitative data. Each graph contains one or more traces, and each trace visualizes tabular data that includes one, two, or three columns:

One-column data contains a numerical column. The dashboard assigns a time stamp to each row as the data is received.

Two-column data contains a time-valued column and a numerical column.

Three-column data contains a time-valued column, a numerical column, and a string (data-label) column.
Use the
traceCount property to specify the number of traces to be included in the chart. Use the
traceNValue and
traceNValueTable properties to attach data to the
Nth overlay.
Alternatively, enable
multiTraceTableFlag and use
multiTraceHistoryValueTable and
multiTraceCurrentValueTable in order to specify data for multiple traces by using a single history attachment and a single current value attachment.
Trend graphs include the following visualization objects from the Trends tab:
 Stock Chart
 Sparkline
 Single Variable Trend
 Multiple Variable Trend
 Filled Trend
 Threshold Trend
 Trend with Banded Group
Trend graphs include the following visualization objects from the Trends HTML5 tab:
 Sparkline
 Single Variable Trend
 Multiple Variable Trend
 Filled Trend
 Threshold Trend
 Trend with Trace Group
These visualizations all share the same properties. They differ from one another only with regard to their default values for these properties. When any of these objects is selected in the Builder canvas, the Object Class Name that appears at the top of the Object Properties pane is obj_stockchart.
The Object Properties panel organizes trend graph properties into the following groups:
