Rendering trend charts in HTML5
A dashboard trend graph object can be rendered by using HTML5, which provides added functionalities to the chart object without requiring a Flash Player or other browser plug-in. Select the webChartFlag option to enable this feature. Note: this feature only applies to display server dashboard deployment.
The
webChartFlag option appears in the list of properties for trend graphs (
obj_trendgraph02), as shown in the following image.
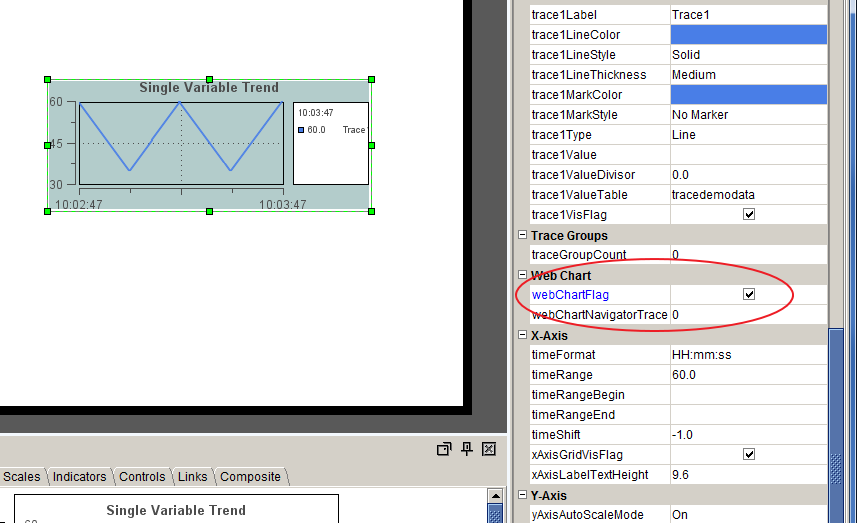
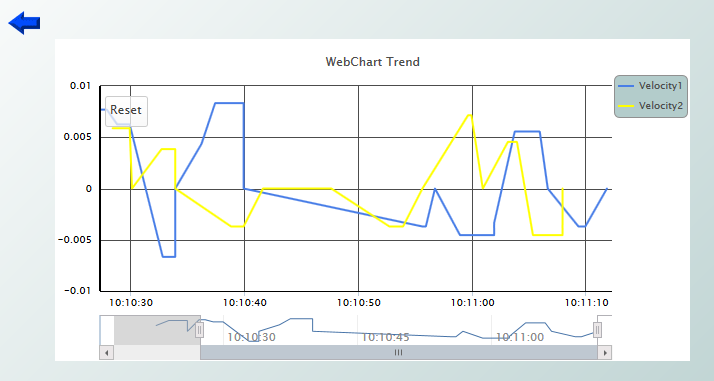
When
webChartFlag is checked the HTML5 rendering of the trend graph object appears in place of the swing trend graph in the display server of an HTML5 compatible browser. For example:
Requirements
A browser that supports HTML5 is required. Browsers that do not support HTML5 will display the swing trend chart regardless of the value of the webChartFlag property.
Properties
A trend chart rendered in HTML5 supports the major properties available in trend graphs. However several minor properties are not supported or have limited support in HTML5-rendered trend charts, as follows:
Background styles | Not supported. Except for the bgColor property, none of the background style properties are supported. This includes the properties whose names begin with bg, traceBg, and border. |
Gradients | Gradient fill is not supported, so none of the properties named *GradientStyle, *GradientMode, or *GradientFlag are supported. |
markDefaultSize
markScale | Not supported. These default to 6 and No Scale. The markers for each trace can be configured with the traceNMarkStyle/Color properties. |
traceNMarkStyle | The markers for traceN can be enabled by setting traceNMarkStyle > 0 but the shape of the markers (for example, circle, square, triangle) is selected automatically. |
traceNType | Supported types are Line and Bar. Event type is not supported. |
legendWidthPercent
legendValueMinSpace | Not supported. The legend (if visible) is sized automatically. |
scrollbarMode/Size
zoomEnabledFlag | Not configurable. The scroll and zoom features are always enabled and the scrollbar size is fixed. |
traceFillStyle
| Supported values are None and Transparent. All other values (Solid, Gradient, Transparent Gradient) are converted to Transparent |
x/yAxisMajor/MinorDivisions
| Not supported. The number of ticks on the x & y axis are selected automatically according to the size of the chart. |
yAxisPostion | Not configurable. The y axis position is always outer-left. |
yAxisAutoScaleVisTracesOnlyFlag | Not configurable, always true. |
x/yAxisFlag x/yAxisThickness | Not configurable. The x and y axes are always visible with a thickness of 1 and 2 pixels, respectively. |
traceGroupNBandedFlag | Not supported. Trace groups are supported but banding within groups is not. |
alert properties (valueHighAlarm*, valueLowAlarm*, valueHighWarning*, valueLowWarning*) | An HTML5-rendered trend chart supports one alert threshold per chart. If more than one alert threshold is enabled, HTML5 rendering will not be used. Also, the alert TraceColor is used only if the traceFillStyle is None. For any other traceFillStyle the alert TraceColor is ignored. The alert TraceStyle, Mark, and MarkColor are ignored. The alarmGlowFlag is not supported. |
The properties marked as not supported or not configurable in the table above will not appear in the dashboard builder's property sheet when a trend graph object is selected and webChartFlag is checked. In some cases, if the properties listed above have been configured on a trend graph instance, then the webChartFlag property will automatically be set to false and hidden in the property sheet, because HTML5 rendering does not support those features. This occurs if any traceGroupNBandedFlag is checked, if more than one alarm threshold is enabled, or if the alarmGlowFlag is checked.
Rendering a trend chart in HTML5 supports two additional properties that are visible in the property sheet only if webChartFlag is checked:
webChartNavigatorTrace | If this property is set to a trace number (a value between 1 and the traceCount value) the HTML5-rendered trend chart will display a "time navigator" at the bottom of the chart, just below the x (time) axis. The navigator plots the data for the indicated trace, and highlights the time range that is currently visible in the chart. The highlighted section can be resized or dragged to perform a time zoom or scroll. The navigator is intended to show the user the entire data set and let the user zoom/pan to the time range of interest. By default webChartNavigatorTrace = 0 so the navigator is disabled. |
yAxisAutoScaleVisDataOnlyFlag | If this property is checked the chart will compute the y axis scale according to the min and max y values of the visible data points only. This means that the y axis scale may change as the user changes the visible time range by scrolling or zooming. By default the property is unchecked and the y axis is scaled according to the y values of all of the data points, visible or not. This matches the behavior of the trend graphs. Dashboard builder does not allow the webChartFlag property to be attached to data. This is by design, since the flag's value is expected to be constant. |
Behavior
In addition to the properties listed above, there are some behavioral differences between an HTML5-rendered trend chart and a swing trend graph. These are described below:

Legend
The legend does not show trace point data (y) values. Data values are only shown in the mouseover tooltips (if cursorFlag = 1). The cursor always snaps to the nearest data point, it does not show interpolated values between data points. Trace labels longer than 200 pixels are wrapped in the legend, and labels longer than 150 pixels are clipped in the tooltip.
Y axis autoscaling
Given the same y data values, an HTML5-rendered trend chart may choose a different value range for the y axes in autoscale mode as compared to swing trend graphs. This is because somewhat different algorithms are used.
Reset button
If the user changes the chart's visible time range, via the scrollbar or navigator or by dragging the cursor to perform a zoom, then a button labeled Reset will appear in the upper left corner of the plot area. A click on this button will reset the time axis to its original settings. The chart will also resume shifting to show the newest trace points, unless the timeRangeBegin/End properties are set.
Data point grouping
Rendering a trend chart in HTML5 makes use of a feature known as data grouping to enhance performance when a trace has many data points. With data grouping, the chart plots a single point using the average y value in cases where otherwise multiple points would be plotted on the same x pixel coordinate.
When data grouping is in effect, the chart's tooltip will display a start time and end time (rather than the usual single time value) to indicate the time range of the averaged data points, for example: 05-Mar 12:35:00 ~ 05-Mar 12:45:00.
Notes: The data point grouping feature is enabled automatically and is not configurable. Also data grouping is performed independently of (and possibly in addition to) any data condensing or compaction that has already been applied by the the historian. Also the maxPointsPerTrace property (3200 in the test1 display) is applied to the raw data, before any data grouping is applied.
The legendTimeFormat property is used to format the date/time strings in the tooltip. If that property is blank then the timeFormat property is used instead. If the string contains a newline it is replaced with a space character to avoid making the tooltip overly tall.
timeShift
Rendering a trend chart in HTML5 does not attempt to keep the tick marks on the time axis aligned on even multiples of the timeShift value, in the case where timeShift > 1.
Also, even if webCharFlag is set on all instances, the swing trend graph will still be used if a display is opened in Internet Explorer 8 or older, or if certain properties not supported by an HTML5-rendered trend chart (as listed above) are configured on a specific trend graph. To disable rendering trend charts in HTML5 globally, regardless of the webChartFlag value on individual objects, specify the
--apama.extendedArgs "-nohtml5"
argument on the display server command line.
Known issues and limitations
Consider the following when you use HTML5-rendered trend charts:
After zooming or scrolling, the time axis labels may briefly be misaligned or overlap. They should be drawn correctly on the next refresh.
The chart's tooltip may overlap the
Reset button making it difficult to click the button. Moving the mouse a bit will correct this problem.
HTML5 rendering will display all timestamps using the local time zone. This may cause user confusion if the display server is in a different time zone.
Performance is affected by the number of traces, trace points, use of trace line shadows, trace line thickness, trace markers, trace fill, and other properties. Performance is also affected by the browser and version, and the CPU speed of the client host system.
If any of the chart's graphical properties are changed while the chart is displayed (for example the
traceFillStyle property is toggled by means of a checkbox control) the chart is rebuilt in the thin client, which in turn resets the chart's time range (as though the
Reset button was clicked).
Scrolling: If the mouse is moved below the bottom of the chart while dragging the scrollbar, the scrolling will stop. This is unlike the behavior of other objects, which will continue to scroll until the mouse button is released.
Drilldown from trace points: If
traceFillStyle is not
None (that is, trace fill is enabled) and multiple traces share the same
Y axis, then it is not possible to click on a point belonging to
traceN if the fill area of a higher numbered trace is drawn over that point.
When
yAxisLogFlag = 1 and the chart has multiple
y axes and traces, some
y axis labels may appear rather than numeric values. This is rare.
Since HTML5-rendered trend charts do not support
legendWidthPercent, the width of each chart's legend will vary according to the trace labels. This makes it difficult to create multiple trend chart instances on the same display whose time axes are all the same length, even if the charts all have the same width. (A single chart in stripchart mode may be more appropriate in those cases).
On a touch interface, a swipe will scroll the chart left or right. To move the cursor without scrolling, tap the location to which you want the cursor to move.
On a touch interface, a pinch-open gesture in the plot area, scrollbar, or navigator will zoom the chart's range in to the pinched range. A pinch-close gesture will zoom out to the pinched range. The pinch-close operation may be difficult to use. A tap on the
Reset button gives a better zoom-out experience.
Hidden properties when webChartFlag is selected
Following is the list of obj_trendgraph02 properties that are hidden when webChartFlag is checked:
borderPixels labelMinTabWidth legendWidthPercent legendBgGradientMode legendBgGradientColor2 legendValueMinSpace markDefaultSize markScaleMode outlineColor scrollbarMode scrollbarSize zoomEnabledFlag timeRangeOfHistory traceBgColor traceBgGradientMode traceBgGradientColor2 traceBgImage yAxisAutoScaleVisTracesOnlyFlag yAxisFormat yAxisFlag yAxisPosition yAxisValueLabels yAxisMajor/MinorDivisions xAxisFlag xAxisMajorDivisions For each traceN, the following properties are hidden:
traceNValueAlarmStatus traceNValueAlarmStatusTable traceNValueHistoryFlag traceGroupNBandedFlag traceNYAxisGridVisFlag traceNYAxisMinLabelWidth traceNYAxisValueLabels traceNYAxisVisFlag traceNYAxisAutoScaleMode traceNYAxisValueMin traceNYAxisValueMax