Using OHLC values
The OHLC values for a stock chart can be provided by attaching the stock chart to one of the following:

OHLC table
Scenario trend table (requires that the scenario have open, high, low, and close variables)
Scenario instance table (requires that the scenario have open, high, low, and close variables)
The simplest is to attach the chart to a scenario OHLC table. This is specified when creating the attachment in the Attach to Apama dialog.
When attaching to a scenario OHLC table, you need only specify the scenario variable you want to chart OHLC values for and a time interval. Apama will then automatically calculate the OHLC values. No modifications to your scenario are required. The following section uses the Stock Chart tutorial sample.
1. Select the stock chart object in the tutorial-stock-chart.rtv file.
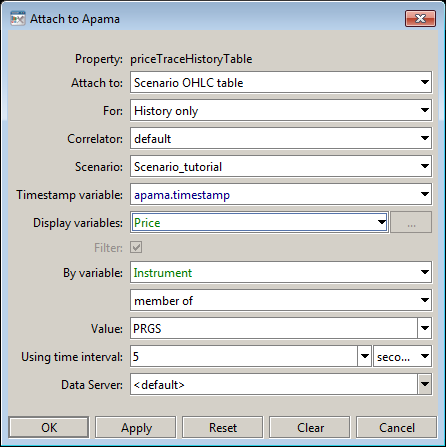
2. In the Object Properties panel, double-click the priceTraceHistoryTable property to display the attachment settings for the stock chart
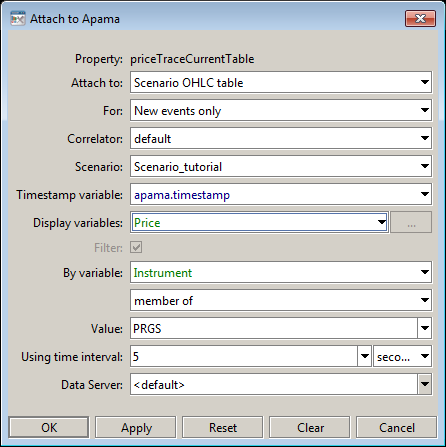
3. In the Object Properties panel, double-click the priceTraceCurrentTable property to display the attachment settings for the stock chart.
Here the attachment is made to the scenario OHLC table of the tutorial scenario and the Price variable is being displayed. This is the variable for which OHLC values will be calculated and displayed. The event timestamp, apama.timestamp, is the timestamp used to determine the time of events. The time interval is set to 5 seconds resulting in an OHLC value being charted every 5 seconds where each represents the preceding 5 seconds. The filter is set to match the scenario instance where the variable Instrument equals APMA.
When attaching to a scenario OHLC table, you must specify the time interval so that Apama knows what interval to use to calculate OHLC values. The time interval field is only enabled when attaching to a scenario OHLC table.
You must also specify a filter. As with trend charts a stock chart displays the value of one variable of a single scenario instance over time. If a filter matches more than one scenario instance the first found will be displayed.
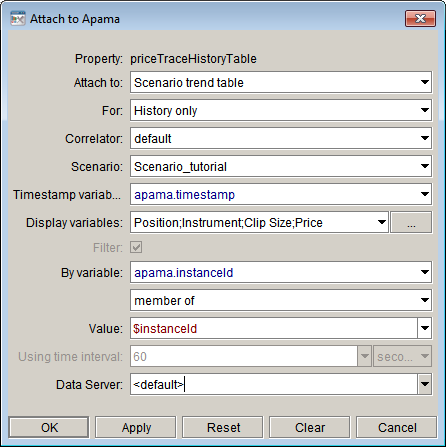
The second way to provide OHLC data for a stock chart is to attach it to a scenario trend table. Do this when you want control of the calculation of OHLC values in a scenario. This requires that the scenario have variables for open, high, low, and close. When attaching a stock chart to scenario trend data you must specify for the display variables the individual open, high, low, and close variables of the scenario.
In this illustration, the attachment is made to the scenario trend table of the OHLC scenario. The scenario variables open, high, low, and close are used to provide the OHLC values. Notice that the Using time interval field is disabled. This is because the scenario is calculating the OHLC values; not the dashboard or dashboard server.
The names of the scenario variables do not matter. However they must be specified in the order open, high, low, and close. Only number variables can be used. String variables must be converted to numbers for use in stock charts.
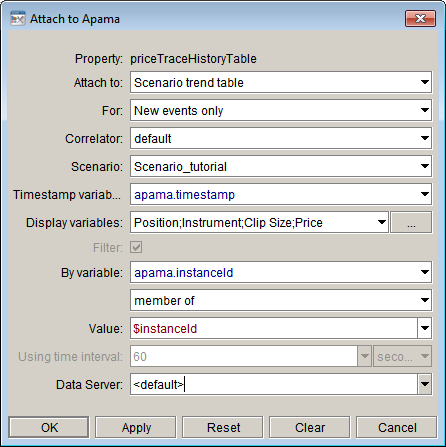
The third way to provide OHLC data for a stock chart is to attach it to a scenario instance table. This is similar to attaching to a scenario trend table in that the scenario has control over the calculation of the OHLC values. It differs in that OHLC data for only one instance of the scenario is maintained in memory. This is valuable when you want to minimize memory use. However, it results in the chart being reset, cleared of all data, whenever OHLC values for a different scenario instance are displayed.
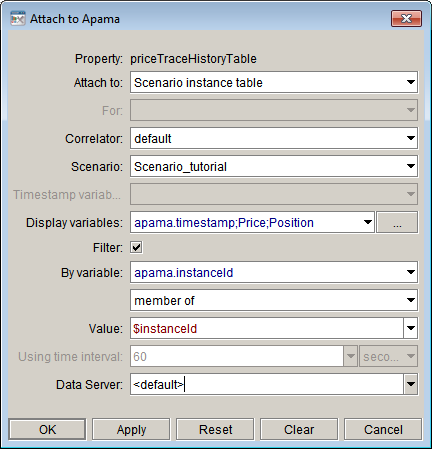
Use the priceTraceHistoryTable when attaching a stock chart to a scenario instance table. Attaching the priceTraceCurrentTable property to a scenario instance table will result in only the latest data value being displayed.
In this illustration, the attachment is made to the scenario instance table of the OHLC scenario. The scenario variables open, high, low, and close are used to provide the OHLC values. If you do not enable the Timestamp variable field for scenario instance table attachments, you need to specify the timestamp as the first entry in the Display variables field; here apama.timestamp is being used.
Note: Unless you have severe memory constraints or are displaying OHLC values for only a single scenario instance, you should attach the priceTraceHistoryTable property to either a scenario OHLC table or a scenario trend table, as this provides the best usage experience for the dashboard user.