Group by Unique Values
Returns a table that contains a summary of all the data in a given table. The summary data in the returned table is grouped by unique values in specified index columns.
Arguments
The function has the following arguments:
 Table
Table: Table whose data is to be summarized.
Group Type: Text string that specifies the type of aggregation to perform. Enter one or more of the following:
sum,
count,
average,
min,
max. The default is
sum. For multiple group types, use a semicolon-separated list and set
Use Column Names to
0..
Index Column Names: Text string that specifies the column or columns to be used to form indexes. Separate column names with a semicolon. If this argument is not supplied, the function uses the first column of
Table as the index column. If this argument is supplied, the function forms indexes by concatenating the values contained in each index column, and aggregates by index value.
Value List: Table column that contains a set of values to be included in the set of values for the first index column. This is useful if you want the summary table to include values that may or may not be in the
Table data.
Restrict To Value List: Numerical value (
0 or
1) that determines whether the table includes only rows that include the values of
Value List. If set to
1, only such values are included.
Use Column Names: Numerical value (
0 or
1) that determines whether original column names are retained in the returned table. If
Use Column Names is set to
1, original column names are retained. If set to
0, columns are given generic names.
Restrict To Data Combinations: Numerical value (
0 or
1) that determines whether the returned table is restricted to only those combinations of values found in the specified index columns that occur in the data. If set to
0, the returned table contains all possible combinations of unique values found in the specified index columns. Set this to
0 if multiple group types are specified.
This function returns a table.
Examples
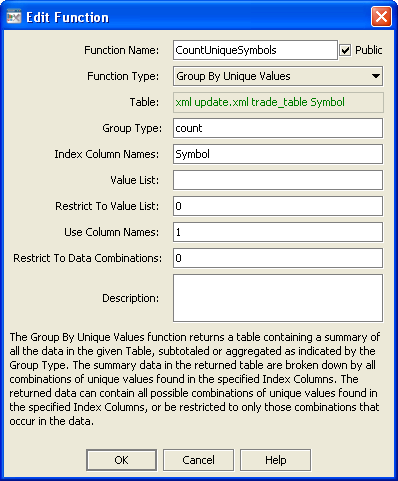
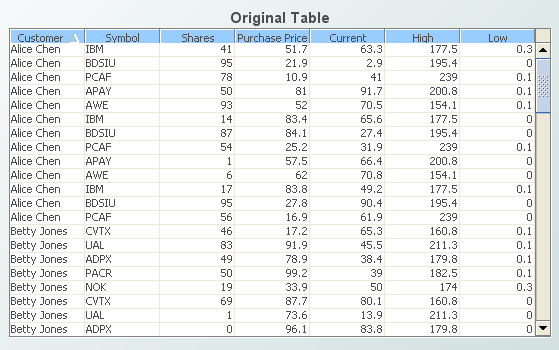
The pie graph and the second table below are attached to the function defined by the following dialog. The first table's data table is attached to the argument Table.
Group By Unique Values example 1
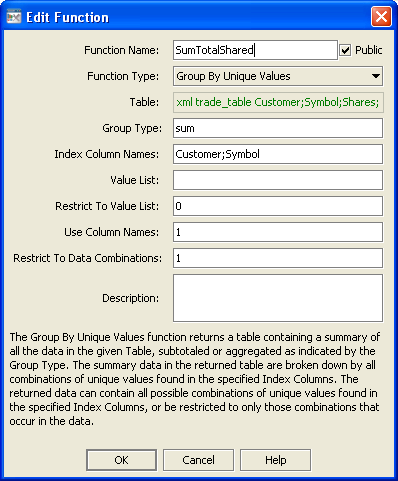
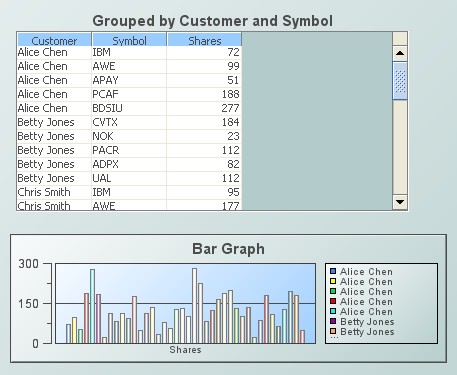
The bar graph and the second table below are attached to the function defined by the following dialog. The first table's data table is attached to the argument Table.
Group By Unique Values example 2