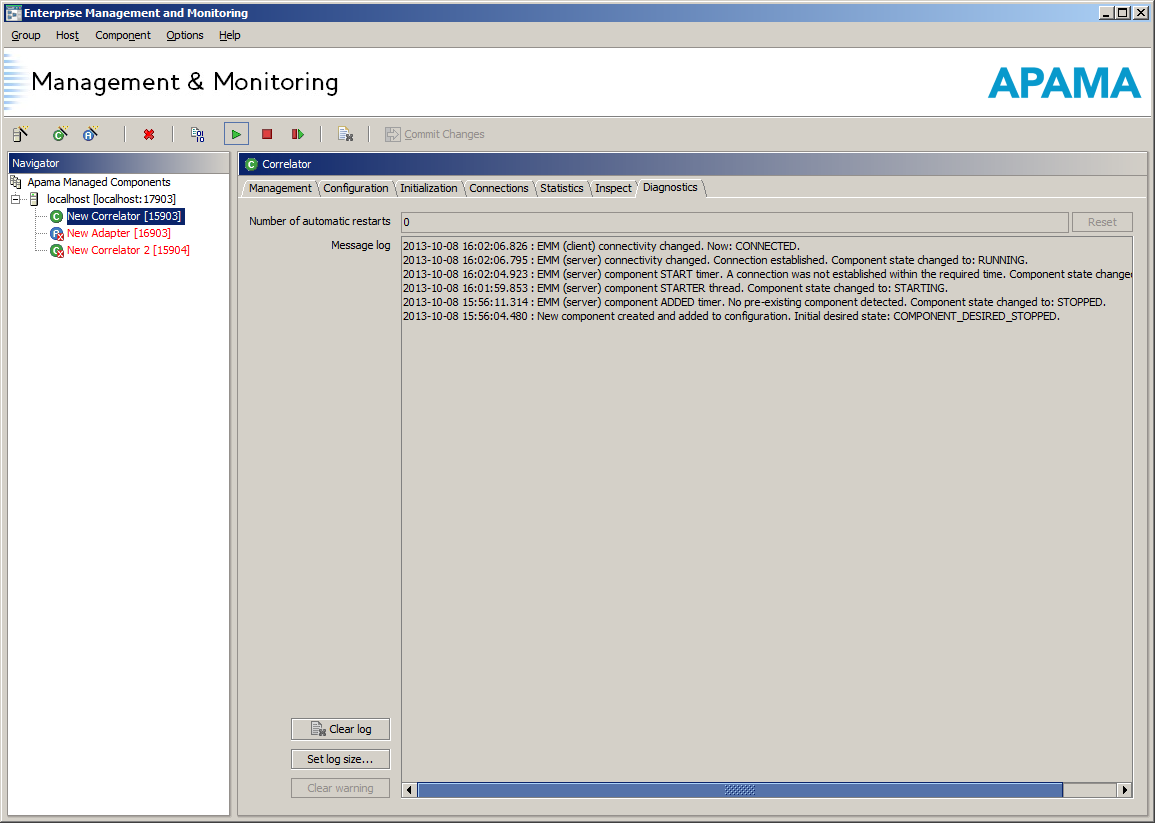
Diagnostics tab
The Diagnostics tab displays diagnostics information about the changes in the state of the correlator.
It provides two elements of diagnostics information:
 Number of automatic restarts
 – the total number of automatic restarts since the last time you manually started the component or since you enabled automatic restart. See
Management tab for details of how automatic restart behavior can be configured. The
Reset button lets you manually reset the counter and make EMM auto-restart the component again if it is currently in the FAIL state.
Message log – A log of diagnostic information generated by EMM. Each log entry starts with the date and time of when the event being logged occurred. Note that most entries are tagged as being generated by
EMM (server) or
EMM (client).
EMM (client) indicates the graphical front-end, whereas
EMM (server) indicates the backend model.
The Message log has three associated buttons:
Clear log – Removes all the messages logged for this component.
Set log size… – Configures the size of the diagnostics log for this component. Note that the default log size assigned to new components can be configured from the Preferences dialog, and is set to
100 entries when Apama is installed. If the size is exceeded the oldest entries are removed to make way for new entries. Minimum size is 1 line.
Clear warning – Changes the state of the component from
WARN to
RUNNING; see
Component status indicators for a full explanation of the meaning of the
WARN state. This button is only enabled when the component is started and in the
WARN state.