Google map
The map object displays an embedded Google map in Display Server clients.
In the Builder, a Google map instance appears as a gray rectangle which you use to set the size and position of the map object, and also configure the latitude, longitude, zoom level and other map object properties through the Builder's property sheet. The Google map object is rendered only when the display is opened in the Display Server deployment.
In the Builder and Viewer, the Google map object instance appears as an empty gray rectangle. The Viewer does not support the map object.
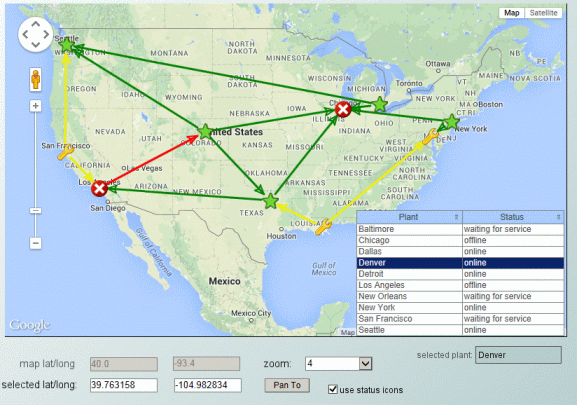
Using the map object properties and RTView data attachments, the map object can be populated with marker objects at specific latitude/longitude positions, and also links between the markers. RTView drilldown and command operations can be triggered by clicking on the map object, as well as on its markers and links. Double-click, right-click, and drillDownColumn substitutions are supported as on other table-driven objects. Operations such as zoom, pan and marker selection can be tied to substitutions.
The Thin Client must have internet access to download the Google Maps Javascript API and map data. The Thin Client supports Google Maps in our supported browsers. The Thin Client loads the Google Maps Javascript API to render and manipulate the map. In most cases, a key or license must be obtained from Google for business use of the Google Maps Javascript API. For details, see the
Licensing section.
The Object Properties panel organizes Google map object properties into the groups below.