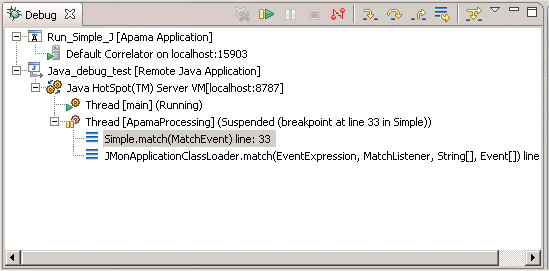

Resume | Select the Resume command to resume execution of the currently suspended debug target. | |
Suspend | Select the Suspend command to halt execution of the currently selected thread in a debug target. | |
Terminate | Ends the selected debug session and/or process. The impact of this action depends on the type of the item selected in the Debug view. | |
Disconnect | Detaches the debugger from the selected process (useful for debugging attached processes). | |
Step Into | Select to execute the current line, including any routines, and proceed to the next statement. | |
Step Over | Select to execute the current line, following execution inside a routine. | |
Step Return | Select to continue execution to the end of the current routine, then follow execution to the routine’s caller. | |
Drop to Frame | Select the Drop to Frame command to re-enter the selected stack frame in the Debug view. | |
Use Step Filters | Select the Use Step Filters command to change whether step filters should be used in the Debug view. |