Building and Using Dashboards > Building Dashboard Clients > Attaching Dashboards to Correlator Data > Using pie and bar charts
Using pie and bar charts
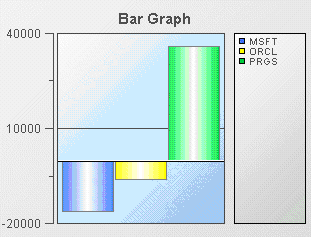
Pie and bar charts can be used in dashboards as an alternative to table objects for showing scenario or DataView summary data. The charts are similar in their configuration and behavior. The following illustration shows a typical bar chart:
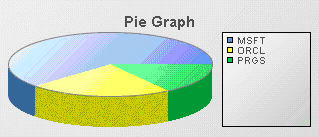
The following illustration shows a typical pie graph.
Both the bar and pie charts shown above display the value of Position for each scenario instance. The bar chart provides an indication of negative values but the pie chart does not. Each chart supports drilldowns similar to those supported by table objects.
Common tasks related to pie and bar charts are covered in the following sections:
Creating a summary pie or bar chart
Using series and non-series bar charts
Performing drilldowns on pie and bar charts
Detailed reference information on graphs, including pie and bar charts, is provided in Graph Objects.
Copyright © 2013-2015 Software AG, Darmstadt, Germany and/or Software AG USA Inc., Reston, VA, USA, and/or its subsidiaries and/or its affiliates and/or their licensors.
Use, reproduction, transfer, publication or disclosure is prohibited except as specifically provided for in your License Agreement with Software AG.