Pivot On Unique Values
Returns a table in which row data from a specified table is rotated into columns.
Arguments
The function has the following arguments:
 Pivot Name Column
: Text string that specifies the column containing values that become new column names in the returned table.
 Key Column
: Text string that specifies the column used to group rows containing unique names in
Pivot Name Column into a single row.
 Pivot Value Column
: Text string that specifies the column containing the data of interest. All consecutive rows that contain the same value in
Key Column have the data in the
Pivot Value Column subtotaled into the same row of the resulting table, in the appropriate column.
 Name List
: Text string that specifies values for which columns should be included in the returned table. To include columns in the returned table for names that are not present in
Pivot Name Column, specify a semicolon-separated list of names.
 Restrict to Name List
: Numerical value that determines whether the returned table contains columns
only for items in
Name List. If set to 0 or if
Name List is not specified, all unique values from
Pivot Name Column are included in the returned table; otherwise only values from the
Name List are included.
This function returns a table.
Example
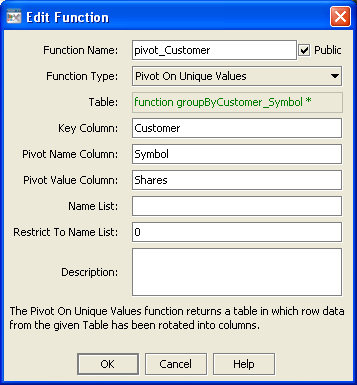
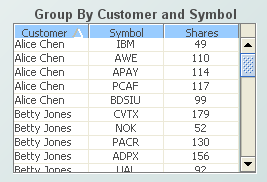
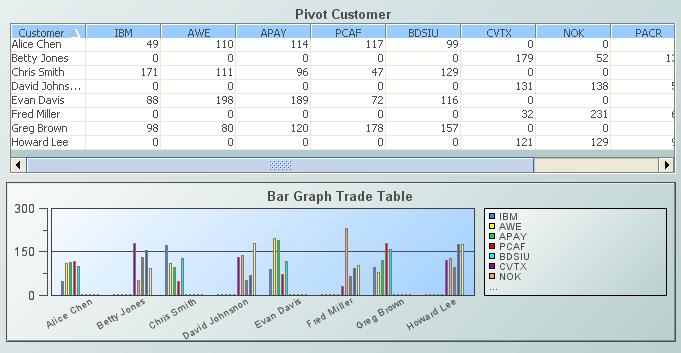
The bar chart and the second table (labeled Pivot Customer), below, are attached to the function defined by the following dialog. The first table’s data table is attached to the argument Table.
Pivot On Unique Values example


