Building and Using Dashboards > Using the Dashboard Viewer > Using the Dashboard Viewer > Working with Dashboard Objects > Stock charts
Stock charts
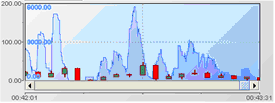
Stock charts provide the ability to view open, high, low, and close values, at a specified time interval, for a variable of a scenario instance or field of a DataView item. Stock charts support the same zooming, scrolling, and maximum-number-of-values behavior as trend charts.
Stock chart
Copyright © 2013-2015 Software AG, Darmstadt, Germany and/or Software AG USA Inc., Reston, VA, USA, and/or its subsidiaries and/or its affiliates and/or their licensors.
Use, reproduction, transfer, publication or disclosure is prohibited except as specifically provided for in your License Agreement with Software AG.