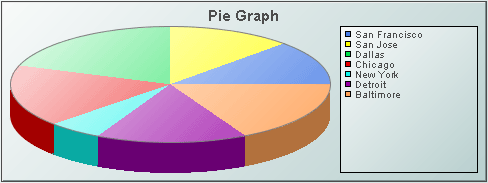
Pie graphs visualize one or more numerical columns from tabular data. A typical attachment has either one row and multiple numeric columns, or multiple rows with one numeric column and one non-numeric column (whose values are used as graph labels that uniquely identify each row).
Use the
valueTable property to attach data to a pie graph. Use the
rowSeriesFlag property to specify row series or column series visualization.
